Telangana TSBIE TS Inter 1st Year Zoology Study Material 2nd Lesson Structural Organisation in Animals Textbook Questions and Answers.
TS Inter 1st Year Zoology Study Material 2nd Lesson Structural Organisation in Animals
Very Short Answer Type Questions
Question 1.
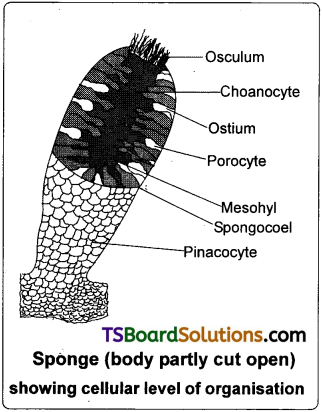
The body of sponges does not possess tissue level of the organisation, though it is made up of thousands of cells. Comment on it.
Answer:
Sponges belonging to group Parazoa are example of cellular level of organisation. The cells are arranged as loose cells aggregates and do not form tissues. There is division of labour among the cells.
Question 2.
What is ’tissue’ level of organisation among animals? Which metazoans do exhibit this organisation?
Answer:
This is the lowest level of organisation among the eumetazoans, exhibited by diploblastic animals like the cnidarians. In these animals, the cells which perform the same function are arranged into tissues. There is a co-ordination between functioning of cells because of nerve cells and sensory cells.
Question 3.
Animals exhibiting which level of the organisation lead relatively more efficient way of life when compared to those of the other levels of organisation? Why?
Answer:
Animals exhibiting organ system level of organisation lead relatively more efficient way of life when compared to those of the other levels of organisation because highly specialized sensory and nerve cells bring about a higher level of co-ordination and integration among the various organ systems.
Question 4.
What is monaxial heteropolar symmetry? Name the group of animals in which it is the principal symmetry.
Answer:
When any plane passing through the central axis (oro-aboral axis) of the body divides an organism into two identical parts, it is called monaxial heteropolar symmetry. In cnidarians it is the principal symmetry.
Question 5.
Radial symmetry is an advantage to the sessile or slow moving organisms. Justify this statement.
Answer:
Animals showing radial symmetry live in water and they can respond equally to stimuli that arrive from all directions. Thus, radial symmetry is an advantage to sessile or slow moving animals.
![]()
Question 6.
What is cephalization? How is it useful to its possessors? [May 2017 – A.P.; March 2015 – T.S.; March 2013]
Answer:
Cephalization is concentration of nerve and sensory cells at the anterior end. As a result of cephalization, bilaterally symmetrical animals can sense the new environment into which they enter and respond more efficiently and quickly.
Question 7.
Mention the animals that exhibited a ‘tube-within-a-tube’ organisation for the first time. Name their body cavity.
Answer:
A tube-with-in-a-tube organisation for the first time is seen in the group Nematoda. Their body cavity is named as Pseudocoelam.
Question 8.
Why is the true coelom considered a secondary body cavity? [March 2015 – T.S.]
A. During the embryonic development of the eucoelomates, the blastocoel is replaced by true coelom derived from the mesoderm. So, the true coelom is also called ‘Secondary body cavity’.
Question 9.
What are retroperitoneal organs? [March 2018 – A.P.]
Answer:
Certain organs such as the kidneys of the vertebrates are covered by the parietal peritoneum only on their ventral side. Such a peritoneum is called retroperitoneum and the organs lined by it are called ‘retroperitoneal organs’.
Question 10.
If the mesentoblast cell is removed in the early embryonic development of protostomes, what would be the fate of such animals?
Answer:
The 4d blastomere or mesentoblast cell Of protostomes divides to form mesodermal blocks between the ectoderm and endoderm. The split that appears in each mesodermal block leads to the formation of schizocoel (true body cavity). If mesentoblast cell is removed, the true coelom will not be formed.
Question 11.
What is enterocoelom? Name the enterocoelomate phyla in the animal kingdom. [March 2014]
Answer:
Animals in which the body cavity is formed from the mesodermal pouches of archenteron are called enterocoelomates. Echinoderms, hemichordates and chordates are the enterocoelomates.
Question 12.
Stratified epithelial cells have limited role in secretion. Justify their role in our skin.
Answer:
Stratified epithelium is made up of more than one layer of cells. Its main function is to provide protection against chemical and mechanical stress. It covers the dry surface of the skin. Hence it has limited role in secretion.
![]()
Question 13.
Distinguish between exocrine and endocrine glands with examples. [March 2014]
Answer:
- Exocrine glands are provided with ducts : secrete mucus, saliva, earwax, oil, milk, digestive enzymes and other cell products.
- Endocrine glands are ductless and their products are hormones which are not sent out via ducts but are carried to the target organs by blood, eg : Thyroid glands secreting hormone Thyroxine.
Question 14.
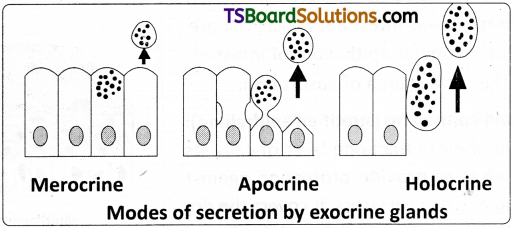
Distinguish between holocrine and apocrine glands.
Answer:
- Apocrine glands (eg : mammary glands) in which the apical part of the cell is pinched off along with the secretory product.
- Holocrine glands (e.g : sebaceous glands) in which the entire cell disintegrates to discharge the contents.
Question 15.
Mention any two substances secreted by mast cells and their functions. [May/June, March 2014]
Answer:
- Heparin – an anticoagulant (prevents blood clotting)
- Histamine – vasodilators (cause inflammation in response to injury and infection.)
Question 16.
Distinguish between a tendon and a ligament. [May 2017-A.P.; March 2017, 15, March 2019]
Answer:
- Tendons attach the skeletal muscles to bones.
- Ligaments attach bones to other bones.
Question 17.
Distinguish between brown fat and white fat.
Answer:
1) White adipose tissue (WAT) :
It is mostly in adults. Adipocyte has a single large lipid droplet (monolocular). White fat is metabolically not active.
2) Brown adipose tissue (BAT) :
It is found in foetuses and infants. Adipocyte of BAT has several small lipid droplets and numerous mitochondria. Brown fat is metobolically active and generates heat to maintain body temperature required by infants.
![]()
Question 18.
What is the strongest cartilage? In which regions of the human body, do you find it? [March 2020 ; Mar 15 – T.S.]
Answer:
Fibrous cartilage is the strongest of all types of cartilage. It occurs in the intervertebral discs and pubic symphysis of the pelvis.
Question 19.
Distinguish between osteoblasts, and osteoclasts. [March 2017 – A.P.]
Answer:
Osteoblasts (Immature bone cells) secrete the organic components (collagen fibres) of matrix and also play a major role in ‘mineralization of bone’.
Osteoclasts are phagocytic cells involved in resorption of bone.
Question 20.
Define osteon. [March 2015 – A.P.]
Answr:
In a dense bone a Haversian canal and the surrounding lamillae (rows of osteocytes) and lacunae are collectively called a Haversian system or Osteon.
Question 21.
What are Volkmann’s canals? What is their role?
Answer:
The Haversian canals communicate with one another, with the periosteum and also with the marrow cavity by transverse or oblique canals called Volkmann’s canals.
Question 22.
What is a Sesamoid bone? Give an example. [May/June 2014]
Answer:
Sesamoid bones are formed by ossification in tendons. Eg : Patella (Knee cap)
Question 23.
What is lymph? How does it differ from plasma?
Answer:
- Lymph is a colourless fluid. It lacks RBC, platelets and large plasma proteins, but has more number of Leucocytes.
- Plasma is the fluid matrix of blood. It consists of 92% of water and 8% of solutes.
Question 24.
What is the haematocrit value? [Mar. 2019, ’17, May ’17 – A.P ; May/June 2014]
Answer:
The percentage of total volume occupied by RBCs is called haematocrit value.
Question 25.
What are intercalated discs? What is their significance?
Answer:
The dark lines across cardiac muscle are called intercalated discs (IDs). These discs are highly characteristic of the cardiac muscle. They act as boosters of muscle contraction.
![]()
Question 26.
“Cardiac muscle is highly resistant to fatigue.” Justify. [March 2020]
Answer:
The cardiac muscle js highly resistant to fatigue because it has numerous sarcosomes, many molecules of myoglobin (oxygen storing pigment) and copious supply of blood which facilitate “Continuous aerobic respiration”.
Question 27.
Distinguish between ‘nucleus’ and ‘ganglion’ with respect to the nervous system.
Answer:
A group of cell bodies in the central nervous system is called a ‘nucleus’ and in the peripheral nervous system, it is called a ‘ganglion’.
Question 28.
Distinguish between tracts and nerves with respect to the nervous system.
Answer:
Groups of axons (nerve fibres) in the central nervous system (CNS) are called tracts and in the peripheral nervous system (PNS) they are called nerves.
Question 29.
Name the glial cells that form myelin sheath around the axons of central nervous system and peripheral nervous system respectively.
Answer:
Myelin sheath around the axons of central nervous system is formed from ‘oligodendrocytes.‘ In peripheral nervous system myelin sheath around axon is formed from ‘Satellite cells’ a kind of glial cells.
Question 30.
Distinguish between white matter and grey matter of ‘CNS’
Answer:
Myelinated nerve fibres occur in the white matter of CNS. Non-myelinated nerve fibres occur in the grey matter of the CNS and autonomus nervous system.
![]()
Question 31.
What are microglia and what is their origin and add a note on their function. [March 2018 – A.P.]
Answer:
Microglial cells which are phagocytic cells, of mesodermal origin. They become activated into ‘phagocytes’ when there is infection or injury in the nervous system.
Question 32.
What are pseudounipolar neurons? Where do you find them?
Answer:
Unipolar neurons are also called pseudounipolar neurons. They are found jn the ‘dorsal root ganglion’ of spinal nerve.
Short Answer Type Questions
Question 1.
Describe the four different levels of organization in metazoans.
Answer:
The levels of organisation in metazoans are as follows.
Cellular level of organisation :
It is the lowest level of organisation among the metazoans and is exhibited by the sponges (parazoans). Different types of cells are functionally isolated due to the absence sensory and nerve cells. The cells are arranged as ‘loose cell aggregates’ and do not form tissues. There is division of labour among the cells.
Tissue level of organisation :
This is the lowest level of organization among the eumetazoans, exhibited by diploblastic animals like the cnidarians. In these animals, the cells which perform the same function are arranged into tissues. The cells of a tissue together perform their common function as a highly coordinated unit and this coordination is due to the presence of nerve cells and sensory cells.

Organ level of organisation :
An aggregation of different kinds of tissues which is specialized for a particular function is called an organ. Organ level of organisation appeared for the first time in the members of the Phylum Platyhelminthes.
Organ – system level of organisation :
It is the highest level of organisation among the animals and is exhibited by the triploblastic animals such as the flat worms, nematodes, annelids, arthropods, molluscs, echinoderms and chordates. In the triploblastic animals, the evolution of ‘mesoderm’ resulted in structural complexity. In these animals, the tissues are assembled to form organs and complex organ – systems. Highly specialized sensory and nerve cells bring about a higher level of coordination and integration among the various organ systems to lead an efficient way of life.
Question 2.
In which group of bilaterians do you find solid bauplan? Why it is called so?
Answer:
Solid bauplan is seen in acoelomate bilaterians eg : Platyhelminthes.
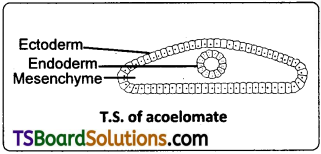
The bilaterian animals in which the body cavity is absent are called acoelomates. In these animals, the mesenchyme derived from the third germinal layer, called mesoderm, occupies the entire blastocoel, between the ectoderm and the endoderm, so that the adults have neither the primary cavity (blastocoelom) nor the secondary cavity (coelom). As there is no body cavity, the acoelomates exhibit solid body plan. Problems faced by the acoelomates due to absence of perivisceral cavity are – their internal organs cannot move freely, as they are embedded in the mesenchyme, diffusion of material from the gut to the body wall is made slow and less efficient.
![]()
Question 3.
Mention the advantages of coelom over pseudocoelom.
Answer:
Advantages of coelom over pseudocoelom :
- Visceral organs of eucoelomates are muscular (because of their association with mesoderm) and so they can contract and relax freely independent of the muscular movements of the body wall in the coelomic space, e.g. peristaltic movements of alimentary canal.
- Gametes are released into the coelom in some invertebrates (which do not have gonoducts) and in the female vertebrates.
- Coelomic fluid receives excretory products and stores them temporarily before their elimination.
- In the eucoelomates, the mesoderm comes into contact with the endoderm of the alimentary canal, and it causes ‘regional specialization of the gut, such as the development of gizzard, stomach etc… This is referred to as ‘primary induction’. In the case of the pseudocoelomates, due to the absence of such a contact between the gut and the mesoderm, the wall of the gut does not show complex and highly specialized organs.
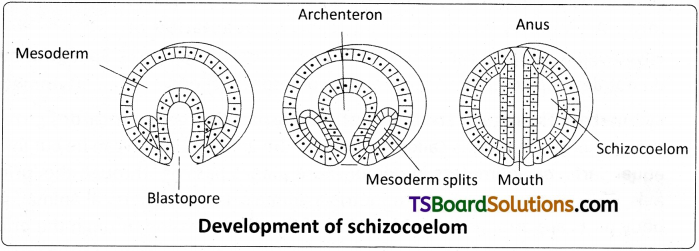
Question 4.
Describe the formation of schizocoelom and enterocoelom.
Answer:
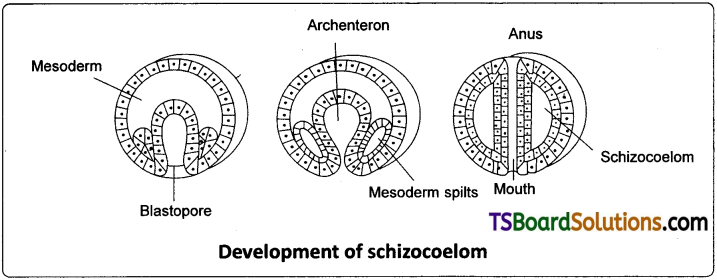
Formation of Schizocoelom: Animals in which the body cavity is formed by ‘splitting of mesoderm’ are called schizocoelomates. Annelids, arthropods and molluscs are schizocoelomates in the animal kingdom. All the schizocoelomates are protostomians and they show ‘holoblastic’, ‘spiral’ and ‘determinate’ cleavage. The 4d blastomere or mesentoblast cell of the early embryo divides to form mesodermal blocks between the ectoderm and the endoderm and replaces the blastocoel. The split that appears in each mesodermal block leads to the formation of Schizocoelom. Eg : Annelida, Arthropoda, Mollusca.
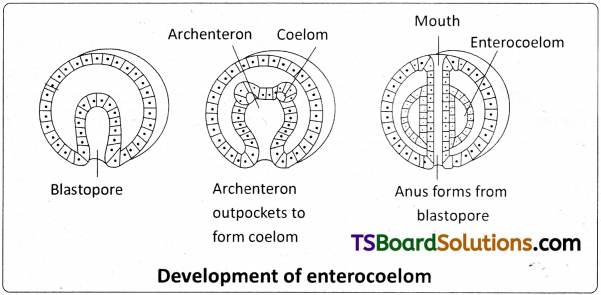
Formation of enterocoelom :
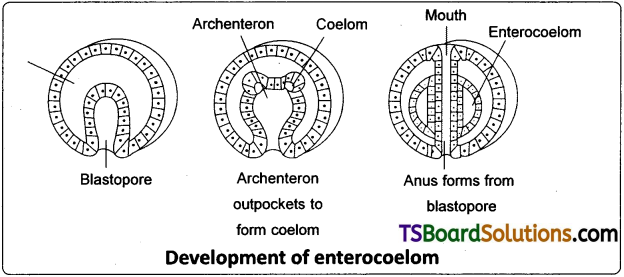
Animals in which the body cavity is formed from the mesodermal pouches of archenteron are called enterocoelomates. Echinoderms, hemichordates and chordates are the enterocoelomates. In these animals, mesodermal pouches that evaginate from the wall of the archenteron into the blastocoel are fused with one another to form the enterocoelom. All the enterocoelomates are deuterostomes and they show radial and indeterminate cleavage.
Question 5.
Describe briefly about the three types of intercellular junctions of epithelial tissues.
Answer:
There are three types of intercellular junctions of epithelial tissues.
A. Tight junctions :
These junctions between epithelial cells prevent ‘leakages’ of body fluids. For example, they prevent leakage of water into the surrounding cells in our sweat glands (making our skin water-tight).
B. Desmosomes :
Muscle cells are provided with ‘desmosomes (anchoring junctions) which act as ‘rivets’ binding the cells together into strong sheets. Intermediate filaments made of the protein ‘keratin’, anchor desmosomes in the cytoplasm.
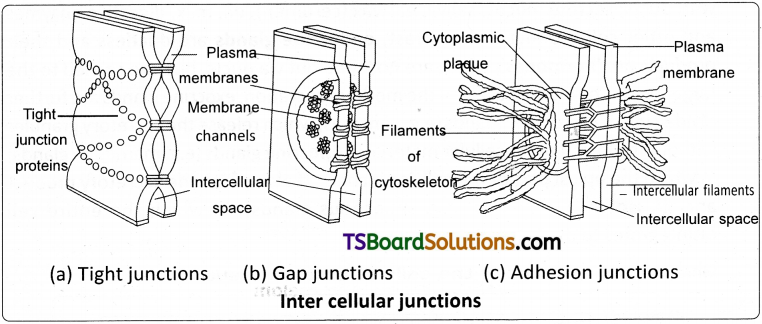
C. Gap junctions :
They provide continuous ‘cytoplasmic channels’ between adjacent cells (comparable to the ‘plasmodesmata’ between adjacent plant cells). Various types of ions, sugar molecules, amino acids etc., can pass from a cell to an adjacent cell through ‘gap junctions’. They occur in many types of tissues including the ‘cardiac muscles’, where they allow rapid conduction of impulses or depolarisation.
Question 6.
Give an account of glandular epithelium. [March 2015 – A.P.]
Answer:
Some of the columnar or cuboidal cells that get specialised for the production of certain secretions, form glandular epithelium. The glands are of two types – unicellular glands consisting of isolated glandular cells such as goblet cells of the gut, and multicellular glands consisting of clusters of cells such as salivary glands.
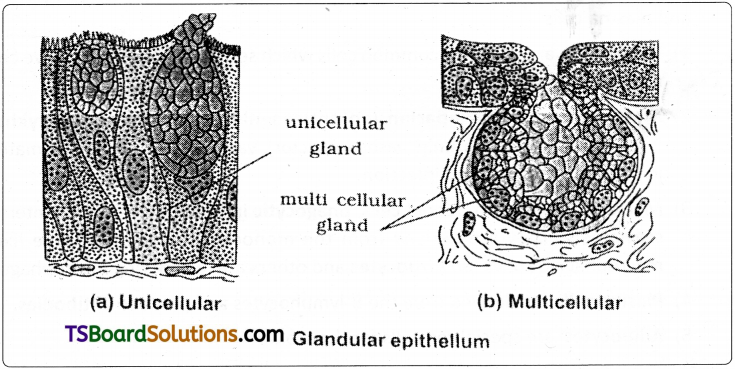
On the basis of the mode of pouring of their secretions, glands are divided into two types namely exocrine and endocrine glands. Exocrine glands are provided with ducts; secrete mucus, saliva, earwax (cerumen), oil, milk, digestive enzymes and other cell products. In contrast, endocrine glands are ductless and their products are ‘hormones’, which are not sent out via ducts, but are carried to the target organs by blood. Based on the mode of secretion, exocrine glands are further divided into i. Merocrine glands (e.g. pancreas) which release the secretory granules without the loss of other cellular material ii. Apocrine glands (e.g. mammary glands) in which the apical part of the cell is pinched off along with the secretory product and iii. Holocrine glands (e.g. sebaceous glands), in which the entire cell disintegrates to discharge the contents.
![]()
Question 7.
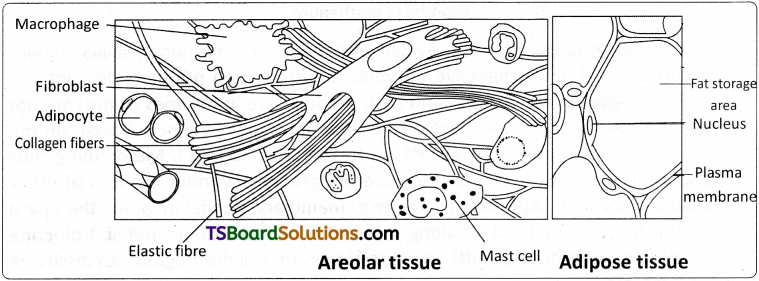
Give a brief account of the cells of areolar tissue.
Answer:
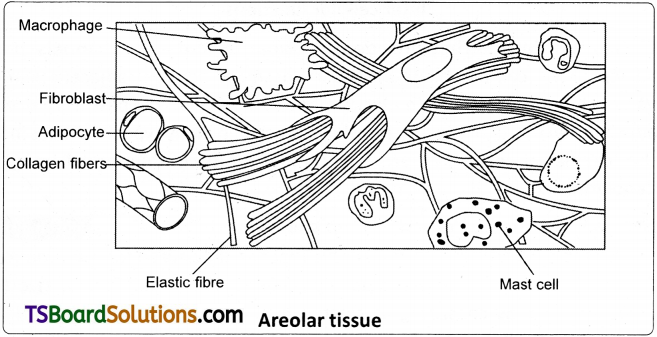
Cells of the areolar tissue are fibroblasts, mast cells, macrophages, adipocytes and plasma cells.
- Fibroblasts are the most common cells which secrete fibres. The inactive cells are called fibrocytes.
- Mast cells secrete heparian (an anticoagulant), histamine, bradykinin (vasodilators), and serotonin (vasoconstrictor). Vasodilators cause inflammation in response to injury and infection.
- Macrophages are amoeboid cells, phagocytic in function and act as internal scavengers. They are derived from the monocytes of blood. ‘Tissue fixed macrophages’ are called histiocytes and others are ‘wandering macrophages’.
- Plasma cells are derived from the B-lymphocytes and produce antibodies.
- Adipocytes are specialized cells for the storage of fats.
Question 8.
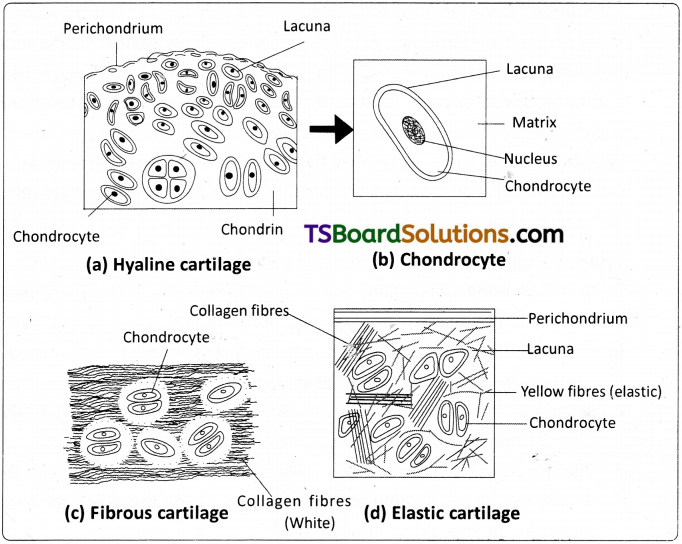
Describe the three types of cartilage. [March 2020, ’17]
Answer:
The three types of cartilage are 1. Hyaline cartilage 2. Elastic cartilage 3. Fibrous cartilage.
1. Hyaline cartilage :
It is bluish-white, translucent and glass – like cartilage. Matrix is homogeneous and shows delicate collagen fibres. It is the weakest and the most common type of all the cartilages. Perichondrium is present except in articular cartilages. It forms the embryonic endoskeleton of bony vertebrates, endoskeleton of cyclostomes and cartilaginous fishes. It forms the articular cartilages (free surfaces of long bones that form joints), costal cartilages (sternal parts of ribs), and the epiphyseal plates. It also forms the nasal septal cartilage, cartilaginous rings of trachea, bronchi and cartilages of larynx.
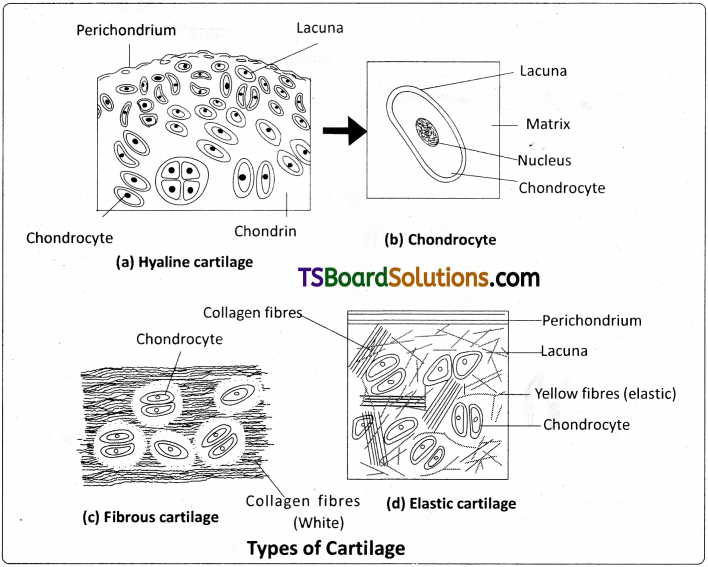
2) Elastic cartilage :
It is yellowish due to elastic fibres. Matrix has abundance of yellow elastic fibres in addition to collagen fibres. It provides strength and elasticity. Perichondrium is present. It is found in the pinnae of the external ears, Eustachian tubes and epiglottis.
3) Fibrous cartilage :
Matrix has bundles of collagen fibres. Perichondrium is absent. It is the strongest of all types of cartilages. It occurs in the intervertebral discs and pubic symphysis of the pelvis.
Question 9.
Explain Haversian system. [May 2017 – A.P; March 2014]
Answer:
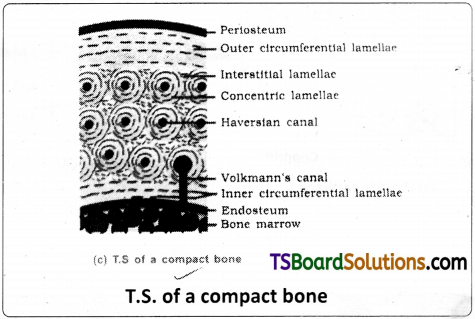
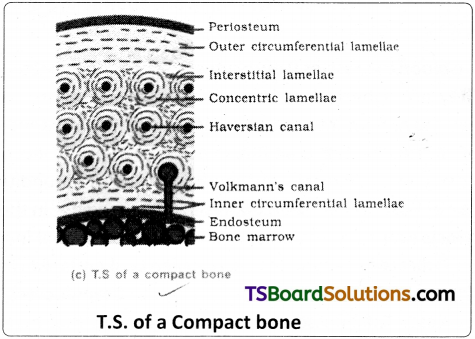
In a bone between the outer and inner circumferential lamellae, there are many Haversian systems. The spaces between the Haversian systems are filled with interstitial lamellae. Haversian system consists of a Haversian canal that runs parallel to the marrow cavity. It contains an artery, a vein and a lymphatic vessel. Haversian canal is surrounded by concentric lamellae, small fluid filled spaces called ‘lacunae’ provided with minute canaliculi lie in between the lamellae. Canaliculi connect the lacunae with one another and with Haversian canal. Each lacuna encloses one osteocyte (inactive form of osteoblast).
The cytoplasmic processes of osteocytes extend through canaliculi. A Haversian canal and the surrounding lamellae and lacunae are collectively called a Haversian system or osteon. The Haversian canals communicate with one another, with the periosteum and also with the marrow cavity by transverse or oblique canals called Volkmanns canals. Nutrients and gases diffuse from the vascular supply of Haversian canals.
Question 10.
Write short notes on Lymph.
Answer:
Lymph :
Lymph is a colourless fluid. It lacks RBC, platelets and large plasma proteins, but has more number of leucocytes. It is chiefly composed of plasma and lymphocytes. When compared to the tissue fluid, it contains very small amounts of nutrients and oxygen but has abundant C02 and other metabolites. The most important site of formation of lymph is interstitial space. As blood passes through the blood capillaries, some portion of blood that includes water, solutes and proteins of low molecular weight passes through the walls of capillaries, into the interstitial spaces due to hydrostatic pressure at the arteriolar ends.
This fluid forms the interstitial fluid (tissue fluid). Most of the interstitial fluid is returned directly to the capillaries due to osmotic pressure at the venular ends. Little amount of this tissue fluid passes through a system of lymphatic capillaries (lymph capillaries of the intestinal villi are called ’lacteals’), vessels, ducts and finally reach the blood through the subclavian veins. The extracecellular ’tissue fluid’ that passes into the lymph capillaries and lymph vessels is called ‘lymph’. Lymphatic system represents an ‘accessory route’ by which interstitial fluid flows from tissue spaces into blood.
Question 11.
Describe the structure of a skeletal muscle. [March 2018 – A.P.; March 2015 – T.S.]
Answer:
Skeletal (striped and voluntary) muscle: It is usually attached to skeletal structures by ‘tendons’. In a typical muscle such as the ‘biceps’ muscle, skeletal muscle fibre is surrounded by a thin connective tissue sheath, the endomysium. A bundle of muscle fibres is called a fascicle. It is surrounded by a connective tissue sheath called perimysium. A group of fascicles form a ‘muscle’ which is surrounded by an epimysium (outermost connective tissue sheath). These connective tissue layers may extend beyond the muscle to form a chord-like tendon or sheet-like aponeurosis.
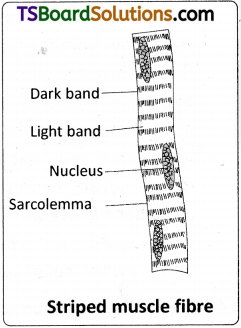
A skeletal muscle fibre is a long, cylindrical and unbranched cell. It is a multinucleated cell with many oval nuclei characteristically in the “peripheral” cytoplasm (a syncytium formed by fusion of cells). Sarcoplasm has many myofibrils which show alternate dark and light bands. So it is called striped or striated muscle. Skeletal muscle usually works under the conscious control of an organism (a voluntary muscle). Skeletal muscle contracts quickly and undergoes fatigue quickly. They are innervated by the ‘somatic nervous system’. Satellite cells are quiescent (quiet and inactive), mononucleate and myogenic cells and help in regeneration, which is ‘limited’.
![]()
Question 12.
Describe the structure of a cardiac muscle. [March 2013]
Answer:
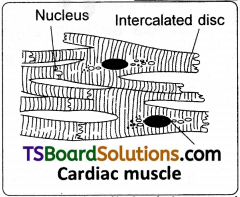
Cardiac (striped and involuntary) muscle :
The cardiac muscle is striated like the skeletal muscle (shows sarcomeres). Cardiac muscle is found in the ‘myocardium’ of the heart of vertebrates. The cardiac muscle cells or the ‘myocardial cells’ are short, cylindrical, mononucleate or binucleate cells whose ends branch and form junctions with other cardiac muscle cells. Each myocardial cell is joined to adjacent myocardial cells by ‘electrical synapses’ or ‘gap junctions’. They permit ‘electrical impulses’ to be conducted along the long axis of the cardiac muscle fibre. The dark lines across cardiac muscle are called intercalated discs (IDs). These discs are highly characteristic of the cardiac muscle.
The cardiac muscle is highly resistant to fatigue, because it has numerous sarcosomes, many molecules of myoglobin (oxygen storing pigment) and copious supply of blood which facilitate ‘continuous aerobic respiration’.
Question 13.
Give an account of the supporting cells of Nervous tissue.
Answer:
Neuroglia (supporting cells):
These are the supporting and non-conducting cells that provide a microenvironment suitable for neuronal activity. Unlike neurons, they continue to divide throughout the life. Neuroglial cells of the CNS include oligodendrocytes; astrocytes (star shaped cells) that form interconnected network and bind neurons and capillaries (helping in providing blood-brain barrier); ependymal cells, which are ciliated cells that line the cavities of brain and spinal cord to bring movements in the cerebrospinal fluid; microglial cells, which are phagocytic cells, of mesodermal origin. Neuroglial cells of the peripheral nervous system include the satellite cells and Schwann cells. Satellite cells surround the cell bodies in ganglia, and Schwann cells form neurilemma around axons.
Question 14.
Describe the structure of a multipolar neuron.
Answer:
A neuron usually consists of a “cell body” with one to many dendrites and a single axon.
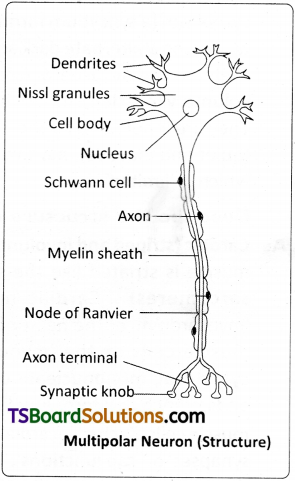
Cell body :
It is also called perikaryon, cyton or soma. It contains abundant granular cytoplasm and a large spherical nucleus. The cytoplasm has Nissl bodies (they represent RER, the sites of protein synthesis), neurofibrils and lipofuscin granules (the products of cellular wear and tear, accumulating in lysosomes with age). A group of cell bodies in the central nervous system is called a ‘nucleus’, and in the peripheral nervous system, it is called a ‘ganglion’.
Dendrites :
Several short, branched processes which arise from the cyton are called dendrites. They also contain Nissl bodies and neurofibrils. They conduct nerve impulses towards the cell body
(afferent processes).
Axon :
An axon is a single, long, cylindrical process that originates from a region of the cyton called axon hillock. Plasmalemma of an axon is called axolemma, and the cytoplasm is called axoplasm, which contains neurofibrils. However, Nissl bodies are absent. An axon may give rise to collateral branches. Distally it branches into many fine filaments called telodendria, (axon terminals), which end in bulb like structures called synaptic knobs or terminal boutons. Synaptic knobs possess ‘synaptic vesicles’ containing chemicals called neurotransmitters. Axon transmits nerve impulse away from the cyton (efferent process) to an interneuronal or neuromuscular junction called synapse.
![]()
Question 15.
Write short notes on (A) Platelets (B) Synapse.
Answer:
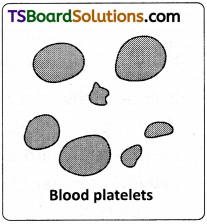
A) Blood platelets (Thrombocytes) :
These are colourless non-nucleated, round or oval biconvex discs. Number of platelets per cubic mm of blood is about 2,50,000 – 4,50,000. They are formed from giant megakaryocytes produced in the red bone marrow by fragmentation. The average life-span of blood platelets is about 5 to 9 days. They secrete thromboplastin and play an important role in blood clotting. They adhere to the damaged endothelial lining of capillaries and seal minor vascular openings.
B) Synapse :
An axon distally branches into many fine filaments called telodendria (Axon terminals) which end in bulb like synaptic knobs or terminal boutons. Synaptic knobs possess synaptic vesicles containing chemicals called neurotransmitters. Axon transmits nerve impulse away from the cyton into an interneuronal or neuromuscular junction called synapse. Synapse is the smallest gap between telodendria of a neuron and dendrites of next neuron.
Essay Answer Type Questions
Question 1.
What is a coelom? Explain the different types of coelom with suitable examples and neat labelled diagrams.
Answer:
Coelom :
The term ‘coelom’ was coined by Haeckel. The body cavity, which is lined by mesoderm, is called coelom. More elaborately, coelom is a fluid-filled space between the body wall and visceral organs and lined by mesodermal epithelium, the peritoneum. Animals possessing coelom are called coelomates/ eucoelomates. Evolution of efficient organ systems was not possible until the evolution of coelom for supporting the organs and distributing material.
Acoelomate bilaterians:
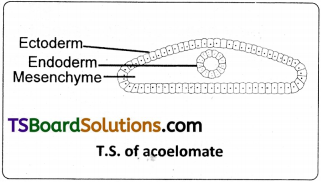
The bilaterian animals in which the body cavity is absent are called acoelomates, e.g. Platyhelminthes (lowest bilaterians). In these animals, the mesenchyme derived from the third germinal layer, called mesoderm, occupies the entire blastocoel, between the ectoderm and the endoderm, so that the adults have neither the primary cavity (blastocoelom). nor the secondary cavity (coelom) As there is no body cavity, the acoelomates exhibit solid body plan. Problems faced by the acoelomates due to absence of perivisceral cavity are – their internal organs cannot move freely, as they are embedded in the mesenchyme, diffusion of material from the gut to the body wall is made slow and less efficient.
Pseudocoelomate bilaterians :
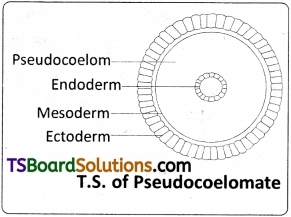
In some animals, the body cavity is not lined by mesodermal epithelia. Such animals are called Pseudocoelomates. They include the members of phylum Aschelminthes (Nematoda, Rotifera and some minor phyla). During the embryonic development mesoderm (mesenchyme) occupies only a part of the blastocoel adjoining the ectoderm. The unoccupied portion of the blastocoel persists as pseudocoelom, which is filled with pseudocoelomic fluid. Pseudocoelomates are the first animals to exhibit a ‘tube-within-a-tube’ organisation.
As the gut wall is made of only endodermal epithelium, diffusion of digested food from the lumen of the gut into the surrounding pseudocoelomic fluid becomes easier and the absence of circulatory system is thus compensated. Though it is called pseudocoelom (false coelom), it performs almost all the functions of a regular coelom. Pseudocoelomic fluid of pseudocoelomates serves as a hydrostatic skeleton and a ‘shock absorber’. It allows the free movements of visceral organs, helps in the circulation of nutrients, and storage of nitrogenous wastes.
Eucoelomate bilaterians:
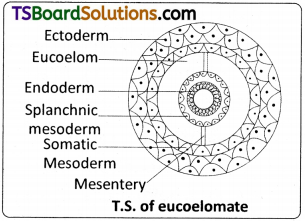
Coelom or ‘true coelom’ is a fluid-filled cavity, that lies between the body wall and the visceral organs and is lined by mesodermal epithelium, the peritoneum. The portion of the peritoneum that underlines the body wall is the parietal peritoneum or somatic peritoneum. The portion of the peritonieum that covers the visceral organs is the splanchnic peritoneum or visceral peritoneum. In coelomates, the visceral organs are suspended in the coelom by the peritoneum. A double layered peritoneum that connects some visceral organs to the body wall is called mesentery.
In some eucoelomates such as the annelids, the dorsal and ventral mesenteries divide the coelom into paired compartments. Certain organs such as the kidneys of the vertebrates are covered by the parietal peritoneum only on their ventral side. Such a peritoneum is called the ‘retroperitoneum’ and the organs lined by it are called ‘retroperitoneal organs’.
During the embryonic development of the eucoelomates, the blastocoel is replaced by true coelom derived from the mesoderm. So, the true coelom is also called ‘secondary body cavity’. In the eucoelomates, mesodermal epithelium (peritoneum) lines both the body wall and the walls of the visceral organs. So, visceral organs become ‘muscular’ and exhibit free movements ‘independent’ of the movement of the body wall in the coelomic fluid. As the wall of the gut becomes thick and muscular, digested food and other nutrients cannot diffuse from the lumen of the gut into the coelom. Circulatory system (blood vascular system) is developed in the eucoelomates to overcome this problem. Based on the mode of formation of coelom, the eucoelomates are classified into two types :
I. Schizocoelomates:
Animals in which the body cavity is formed by spilitting of mesoderm’ are called schizocoelomates. Annelids, arthropods and molluscs are schizocoelomates in the animal kingdom. All the schizocoelomates are protostomians and they show ‘holoblastic’, ‘spiral’ and ‘determinate’ cleavage. The 4d blastomere or mesentoblast cell of the early embryo divides to form mesodermal blocks between the ectoderm and the endoderm and replaces the blastocoel. The split that appears in each mesodermal block leads to the formation of’schizocoelom’ (split coelom).
In annelids, the functional body cavity (perivisceral cavity) is schizocoelom. It is in the form of a series of paired coelomic cavities, but in arthropods and molluscs, the functional body cavity that lies around visceral organs is filled with blood (haemolymph) and is called haemocoel. It is formed by the fusion of the embryonic blastocoel with some coelomic spaces and the tissues are directly bathed in the blood (haemolymph).
II. Enterocoelomates:
Animals in which the body cavity is formed from the mesodermal pouches of archenteron are called enterocoelomates. Echinoderms, hemichordates and chordates are the enterocoelomates. In these animals, mesodermal pouches that evaginate from the wall of the archenteron into the blastocoel are fused with one another to form the enterocoelom. All the enterocoelomates are deuterostomes and they show radial and indeterminate cleavage.
![]()
Question 2.
What is symmetry? Describe the different types of symmetry in the animal kingdom with suitable examples.
Answer:
Importance of Symmetry :
The concept of symmetry is fundamental in understanding the organisation of an animal. Symmetry in animals is balanced distribution of paired body parts. The body plan of a vast majority of metazoans exhibits some kind of symmetry. However, most of the sponges and snails show asymmetry (lack of symmetry). The symmetry of an animal and its mode of life are correlated.
Asymmetry :
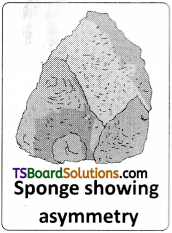
The animals, which cannot be cut into two equal parts (antimeres) in any plane passing through the centre of the body are called asymmetrical, e.g. most sponges and adult gastropods. In the asymmetrical animals, the body lacks a definite form. Asymmetry cannot be said to be an adaptation or advantage to an organism. Most of the asymmetrical organisms do not develop complex sensory and locomotor functions.
Symmetry :
The regular arrangement of body parts in a geometrical design relative to the axis of the body is called symmetry. The animals, which can be cut into two equal parts, or antimeters in one or more planes passing through the ‘principal axis’ of the body are called symmetrical animals. In a symmetrical animal, paired body parts are arranged on either side of the plane passing through the principal axis, such that they are equidistant from the plane. The unpaired body parts are located mostly on the plane, passing through the principal axis. Basically, the symmetry in animals is of two kinds.
i) Radial symmetry and
ii) Bilateral symmetry
i) Radial Symmetry or Monaxial heteropolar (axis is single; poles are different) Symmetry :
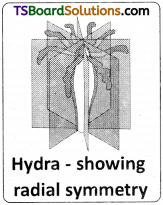
When any plane passing through the central axis (oro-aboral axis/ principal axis) of the body divides an organism into two identical parts, it is called radial symmetry. The animals with radial symmetry are either sessile or planktonic or sluggish forms. It is the principal symmetry of the diploblastic animals such as the cnidarians and ctenophores (considered as biradial animals by some authors).
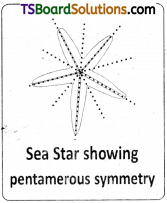
Animals showing radial symmetry live in water and they can respond equally to stimuli that arrive from all directions. Thus, radial symmetry is an advantage to sessile or slow moving animals. However, triploblastic animals such as echinoderms are ‘secondarily radially symmetrical’ (as it is five angled, it is also called pentamerous radial symmetry). Radially symmetrical animals have many planes of symmetry, whereas pentamerous radially symmetrical animals have five planes of symmetry.
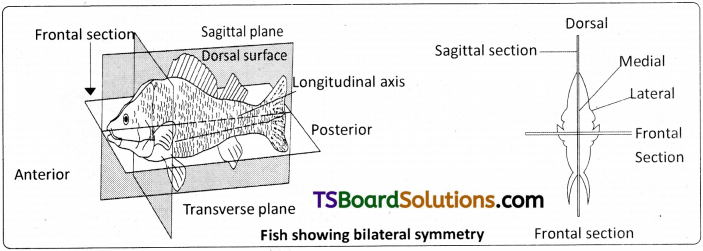
ii) Bilateral symmetry :
When only one plane (median sagittal plane) that passes through the central axis (anterior – posterior axis) divides an organism into two identical parts, it is called bilateral symmetry. It is the ‘principal type of symmetry’ in the triploblastic animals. Among the triploblastic animals, some gastropods become secondarily asymmetrical, though they have primarily bilaterally symmetrical larvae.
Question 3.
Classify and describe the epithelial tissues on the basis of structural modification of cells with examples.
Answer:
There are two types of epithelial tissues namely ‘simple epithelia’ and ‘compound epithelia’ based on the number of layers or strata. Various glands in the body involved in secretions are made up of epithelial tissue (glandular epithelium).
A) Simple epithelium :
Simple epithelium is composed of a single layer of cells and forms the lining of body cavities, ducts and vessels. It helps in diffusion, absorption, filtration and secretion of substances. On the basis of the shape of the cells, it is further divided into three types :
i) Simple squamous epithelium (Pavement epithelium) :
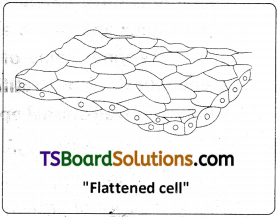
It is composed of a single layer of flat and tile-like cells, each with a centrally located ‘ovoid nucleus’. It is found in endothelium of blood vessels, mesothelium of body cavities (pleura, peritoneum, and pericardium), wall of Bowman’s capsule of nephron, lining of alveoli of lungs, etc.
ii) Simple cuboidal epithelium :
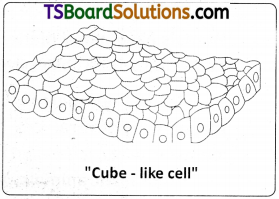
It is composed of a single layer of cube-like cells with centrally located spherical nuclei. It is found in germinal epithelium, proximal and distal convoluted tubules of nephron. Cuboidal epithelium of proximal convoluted tubule of nephron has ‘microvilli’.
iii) Simple columnar epithelium :
It is composed of a single layer of tall and slender cells with oval nuclei located near the base. It has mucus – secreting’ goblet cells’ in some places. It is of two types.
a) Ciliated columnar epithelium :
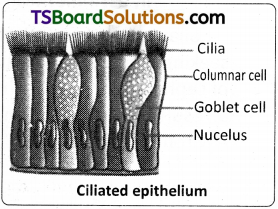
Columnar epithelial cells have cilia on their free surface. It is mainly present in the inner surface of hollow organs like fallopian tubes, ventricles of brain, central canal of spinal cord, bronchioles etc.
b) Non-ciliated columnar epithelium :
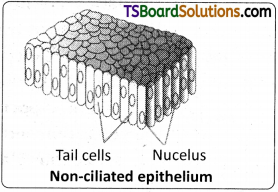
Columnar cells are without cilia. It is found in the lining of Stomach and intestine. Microvilli are present in the columnar epithelium of intestine to increase the surface area of absorption.
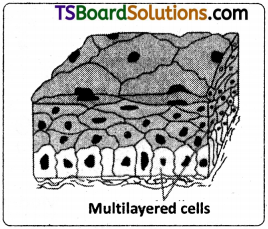
B) Compound epithelium (stratified epithelium):
It is made up of more than one layer of cells. Its main function is to provide protection against chemical and mechanical stress. It covers the dry surface of the skin as stratified, keratinized, squamous epithelium. It covers the moist surface of buccal cavity, pharynx, oesophagus and vagina as stratified non – keratinized squamous epithelium. It forms the inner lining of the larger ducts of salivary glands, sweat glands and pancreatic ducts as stratified cuboidal epithelium. It forms the wall of the urinary bladder as transitional epithelium.
c) Glandular epithelium :
Some of the columnar or cuboidal cells that get specialised for the production of certain secretions, form glandular epithelium. The glands are of two types – unicellular glands consisting of-isolated glandular cells such as goblet cells of the gut, and multicellular glands, consisting of clusters of cells such as salivary glands. On the basis of the mode of pouring of their secretions, glands are divided into two types namely exocrine and endocrine glands. Exocrine glands are provided with ducts; secrete mucus, saliva, earwax (cerumen), oil, milk, digestive enzymes and other cell products. In contrast, endocrine
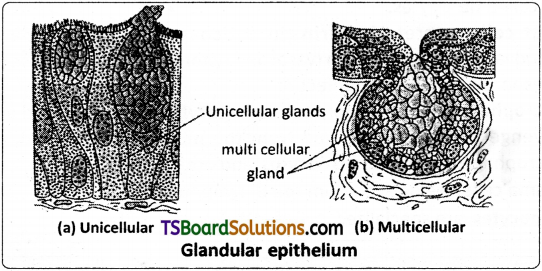
glands are ductless and their products are ‘hormones’, which are not sent out via ducts, but are carried to the target organs by blood. Based on the mode of secretion, exocrine glands are further divided into i. Merocrine glands (e.g. pancreas) which release the secretory granules without the loss of other cellular material ii. Apocrine glands (e.g. mammary glands) in which the apical part of the cell is pinched off along with the secretory product and iii. Holocrine glands (e.g. sebaceous glands), in which the entire cell disintegrates to discharge the contents.
![]()
Question 4.
Describe the various types of connective tissue proper with suitable examples.
Answer:
Connective tissue proper:
It is of two types.
A) Loose connective tissue :
Cells and fibres are loosely arranged in a semi fluid ground substance. There are three types of loose connective tissues – areolar tissue, adipose tissue and reticular tissue.
i. Areolar tissue :
It is one of the most widely distributed connective tissues in the body. It forms the packing tissue in almost all the organs. Areolar tissue forms subcutaneous layer of the skin. It has cells and fibres. Cells of the areolartissue are fibroblasts, mast cells, macrophages, adipocytes and plasma cells.
- Fibroblasts are the most common cells which secrete fibres. The inactive cells are called fibrocytes.
- Mast cells secrete heparin (in anticoagulant), histamine, bradykinin (vasodilators), and serotonin (vasoconstrictor). Vasodilators cause inflammation in response to injury and infection.
- Macrophages are amoeboid cells, phagocytic in function and act as internal scavengers. They are derived from the monocytes of blood. ‘Tissue fixed macrophages’ are called histiocytes and others are ‘wandering macrophages’.
- Plasma cells are derived from the B- lymphocytes and produce antibodies.
- Adipocytes are specialized cells for the storage of fats.
Fibres of areolar tissue are of three types. They are collagen, reticular and elastic fibres. Collagen and reticular fibres are composed of the protein collagen, elastic fibres are made of the protein elastin. Collagen (white) fibres occur in bundles, and they are strong and stretch resistant. Reticular fibres are thin and form a network and they provide strength and support to certain tissues such as bone marrow. Elastic (yellow) fibres are branched and form a network. They are also found in elastic cartilages, elastic ligaments, etc.
ii. Adipose tissue :
It is specialized for fat storage. It consists of a large number of adipocytes and few fibres. Adipose tissue which is found beneath the skin provides thermal insulation. It forms blubber of aquatic mammals such as whales and sea cows and the hump of camel. It acts as shock absorber in palms and soles. Adipose tissue is of two types; white adipose tissue, brown adipose tissue. Excess nutrients which are not used immediately are converted into fats and stored in this tissue.
White adipose tissue (WAT) :
It is the predominant type in the adults, and the adipocyte has a single large lipid droplet (monolocular). White fat is metabolically not active.
Brown adipose tissue (BAT) :
It is found in foetuses and infants. Adipocyte of BAT has several small ‘lipid droplets’ (multilocular) and numerous mitochondria. Brown fat is metabolically active and generates ‘heat’ to maintain body temperature required by infants.
iii. Reticular tissue :
It has specialized fibroblasts called reticular cells. They secrete ‘reticular fibres’ that form an inter connecting network. It forms the ‘supporting frame work’ of lymphoid organs such as bone marrow, spleen and lymph nodes and forms the reticular lamina of the ‘basement membrane’.
B) Dense connective tissue :
This tissue consists of more fibres, but fewer cells. It has very little ground substance. Based on the arrangement of fibres, dense connective tissue is of three types.
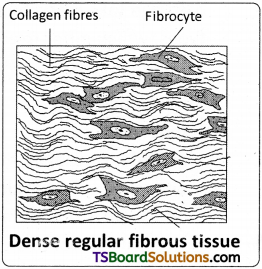
i. Dense regular connective tissue :
In this tissue, collagen fibres are arranged parallel to one another in bundles. Tendons which attach the skeletal muscles to bones and ligaments which attach bones to other bones are examples of this type of connective tissue,
ii. Dense irregular connective tissue :
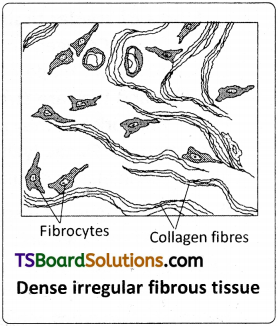
In this type of connective tissue, bundles of collagen fibres are irregularly arranged. Periosteum, endosteum, pericardium, heart valves, joint capsule and deeper region of dermis of skin contain/ are made up of this type of connective tissue.
iii. Elastic connective tissue :
It is mainly made of yellow elastic fibres, capable of considerable extension and recoil. This tissue can recoil to its original shape, when the forces of stretch are released. It occurs in the wall of arteries, vocal cords, trachea, bronchi and ‘elastic ligaments’ present between vertebrate.
In addition to the above mentioned connective tissues, mucous connective tissue occurs as foetal or embryonic connective tissue. It is present in the umbilical cord as Wharton’s jelly.
Question 5.
What is a skeletal tissue? Describe the various types of skeletal tissue.
Answer:
Skeletal tissue (supporting tissue): It forms the endoskeletonof the vertebrates. It supports the body, protects various organs, provides surface for the attachment of muscles and helps in locomotion. It is of two types.
A) Cartilage (Gristle) :
Cartilage is a solid, but semi-rigid (flexible) connective tissue. It resists compression. Matrix is firm, but somewhat pliable. It has collagen fibres, elastic fibres (only in the elastic cartilage) and matrix-secreting cells called chondroblasts. These cells are enclosed in fluid filled spaces called lacunae, chondrocytes are the inactive cells of a cartilage. Cartilage is surrounded by a fibrous connective tissue sheath called perichondrium. Cartilage is ‘avascular’ and it is nourished by ‘diffusion of nutrients’ from the blood capillaries of the perichondrium. Growth, regeneration and repair of cartilage take place by the activity of perichondrial cells. Cartilage is of three types, which differ from each other chiefly in the composition of the matrix.
1. Hyaline cartilage :
It is bluish-white, translucent and glass-like cartilage. Matrix is homogeneous and shows delicate collagen fibres. It is the weakest and the most common type of all the cartilages. Perichondrium is present except in articular cartilages. It forms the embryonic endoskeleton of bony vertebrates, endoskeleton of cyclostomes and cartilaginous fishes. It forms the articular cartilages (free surfaces of long bones that form joints), costal cartilages (sternal parts of. lbs), and the epiphyseal plates. It also forms the nasal septal cartilage, cartilaginous rings of trachea, bronchi and cartilages of larynx.
2) Elastic cartilage :
It is yellowish due to elastic fibres. Matrix has abundance of yellow elastic fibres in addition to collagen fibres. It provides strength and elasticity. Perichondrium is present. It is found in the pinnae of the external ears, Eustachian tubes and epiglottis.
3) Fibrous cartilage :
Matrix has bundles of collagen fibres. Perichondrium is absent. It is the strongest of all types of cartilages. It occurs in the intervertebral discs and pubic symphysis of the pelvis.
B. Bone (osseous) tissue :
Bone is highly calcified (mineralized), solid, hard and rigid connective tissue. It is the major component of the endoskeleton of most adult vertebrates. It is the main tissue that provides structural frame work to the body. It supports the soft tissues, protects the delicate organs. Limb bones of animals serve the weight bearing functions. Bones also interact with muscles attached to them to bring about movements. Bones have a hard and non-pliable matrix, rich in calcium salts and collagen fibres which give the bone its strength. During ageing, the proportion of inorganic materials increases in a bone, making it more brittle. Bone forms homeostatic reservoir of calcium, magnesium, phosphorus, etc. Bone is highly vascular.
Bone has an outer fibrous connective tissue sheath called periosteum, the inner connective tissue sheath that lines the marrow cavity called endosteum, non-living extra cellular matrix, living cells and bone marrow. Bone cells include osteoblasts, osteocytes and osteoclasts. Osteoblasts (immature bone cells) secrete the organic components (collagen fibres) of matrix and also play an important role in ‘mineralization of bone’ and become osteocytes (mature bone cells). Osteocytes are enclosed in fluid filled lacunae. Osteoclasts are phagocytic cells involved in resorption of bone.
Types of bones based on the method of formation :
- Cartilage bones (replacing bones or endochondral bones) are formed by ossification within the cartilage e.g. bones of limbs, girdles and vertebrae.
- Investing bones (membrane bones or dermal bones) are formed by the ossification in the embryonic mesenchyme e.g. most of the bones of cranium.
- Sesamoid bones are formed by ossification in tendons e.g. patella (knee cap) and pisiform bone of the wrist of a mammal.
- Visceral bones are formed by ossification in the soft tissues, e.g. Oscordis (Inside the heart of ruminants), Os penis (inside the glans-penis of many mammals such as the rodents, bats and carnivores).
Types of bones based on the structure :
1) Spongy bone (Cancellous bone or trabecular bone) :
It occurs in the epiphyses and metaphyses of long bones. It looks spongy and contains columns of bone called ‘trabeculae’ with irregular interspaces filled with red bone marrow.
2) Compact bone :
The diaphysis of a long bone is made up of ‘compact bone’. It has dense continuous lamellar matrix between periosteum and endosteum.
Structure of a compact bone :
Diaphysis (shaft) is a part of a long bone that lies in between expanded ends (epiphyses). In a growing bone there is a region called metaphysis between the diaphysis and epiphysis. It consists of an epiphyseal plate (formed by hyaline cartilage). It helps in the elongation of the bone. In adults it is represented by a bony epiphyseal line. Diaphysis is covered by a dense connective fibrous tissue called periosteum.
Diaphysis of a long bone has a hollow cavity called marrow cavity which is lined or surrounded by the endosteum. In between periosteum and endosteum, the matrix of the bone is laid down in the form of ‘lamellae’. Outer circumferential lamellae are located immediately beneath the periosteum; inner circumferential lamellae are located around the endosteum. Between the outer and inner circumferential lamellae, there are many Haversian systems (osteons – units of bone).
The spaces between the Haversian systems are filled with interstitial lamellae. Haversian system consists of a Haversian canal that runs parallel to the marrow cavity. It contains an artery, a vein and a lymphatic vessel. Haversian canal is surrounded by concentric lamellae. Small fluid filled spaces called ‘lacunae’ provided with minute canaliculi lie in between the lamellae. Canaliculi connect the lacunae with one another and with Haversian canal. Each lacuna encloses one osteocyte (inactive form of osteoblast).
The cytoplasmic processes of osteocytes extend through canaliculi. A Haversian canal and the surrounding lamellae and lacunae are collectively called a Haversian system or osteon. The Haversian canals communicate with one another, with the periosteum and also with the marrow cavity by transverse or oblique canals called Volkmann’s canals. Nutrients and gases diffuse from the vascular supply of Haversian canals.
![]()
Question 6.
Give an account of the “formed elements” of Blood.
Answer:
Formed elements :
They include erythrocytes (red blood corpuscles), leucocytes (white blood corpuscles) and platelets. The process of formation of blood cells is called haemopoiesis or haematopoiesis. In the earliest stages of embryogenesis, blood cells are formed from the yolk sac mesoderm. Later on, the liver and the spleen serve as temporary haemopoietic tissues”. In the final stage of embryonic development and after birth, the red bone marrow is the primary site of haemopoiesis.
Red blood corpuscles (Erythrocytes) :

Erythrocytes of mammals are circular (elliptical in camels and Llamas), biconcave and enucleate. The biconcave shape provides a large surface area to – volume ratio, thus providing more area for the exchange of gases. These are 7.8 mm in diameter. The number of RBC per cubic millimeter of blood is about 5 million in a man, and 4.5 million in a woman. Decrease in the number of erythrocytes is called erythrocytopenia and it leads to anaemia. An abnormal rise in RBC count is called polycythemia.Shortage of oxygen stimulates the kidneys to secrete a hormone called erythropoietin into the blood. Erythropoietin stimulates the bone marrow to increase the production of RBC. Vitamin B12 and folic acid are required for maturation of RBC.
Mammalian RBC is surrounded by plasma membrane. Nucleus and other cell organelles are lost in the reticulocyte stage of its development. Cytoplasm of RBC contains a chromo protein, the ‘haemoglobin’. Each Haemoglobin molecule consists of 4 polypeptide (2α & 2β) chains and 4 haeme molecules. In the centre of each haeme group is one Fe2+, which can combine with one molecule of O2. Life span of RBC in humans is about 120 days. The worn out RBC are destroyed in the ‘spleen’ and ‘liver’.
White blood corpuscles (Leucocytes) :
These are.nucleate, colourless, complete cells. They are spherical or irregular in shape, and are capable of exhibiting amoeboid movement into the extravascular areas by diapedesis. They are larger than RBC in size, and less than RBC in number. The total leucocyte count is 6,000 – 10,000 per cubic millimeter of blood under normal conditions. The process of formation of WBC is called Leucopoiesis. Slight increase in the WBC count is called Leucocytosis (during infection and allergy).
An abnormal increase in the number of WBC is indicated in a type of cancer called Leukemia. Fall in WBC count is called Leucocytopenia. WBC are of two main types : Granulocytes and Agranulocytes. Granulocytes : They possess cytoplasmic granules that may take three different types of stains, neutral or acidic or basic. Nucleus of the granulocytes is divided into lobes and assumes different shapes, hence, these are also called Polymorph – nuclear leucocytes. Based on the staining properties these are of three types.
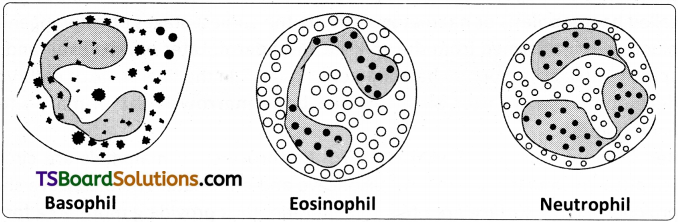
Eosinophils (acidophils) :
They constitute about 2.3% of the total leucocytes. Nucleus is distinctly bilobed. Cytoplasm has large granules which stain with acidic dyes such as ‘eosin’. They play a role in allergic reactions. Their number increases during ‘allergic reactions’ and ‘helminth infections’. They remove ‘antigen – antibody complexes’.
Neutrophils :
They constitute about 62% of the total leucocytes. Nucleus is many lobed (2-5). Specific cytoplasmic granules are small and abundant. They stain with ‘neutral dyes’. These are active phagocytic cells commonly described as ‘microscopic policemen’. Certain neutrophils of female mammals have sex chromatin body or Drumstick body (an extra ‘X’ chromosome) attached to the nucleus.
Agranulocytes :
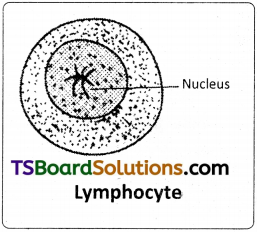
Cytoplasmic granules are absent in agranulocytes. Nucleus of these cells is not divided into lobes. These are of two types; a) Lymphocytes: They constitute about 30% of the total leucocytes. They are small, spherical cells with large spherical nucleus and scanty peripheral cytoplasm. There are functionally two types of lymphocytes – ‘B’ lymphocytes, which produce ‘antibodies’ and ‘T’ lymphocytes which play the key role in the immunological reactions of the body.
Some lymphocytes live only a few days while others survive for many years.
Monocytes :
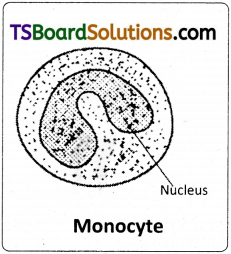
They constitute about 5.3% of the leucocytes. The nucleus is kidney shaped (reniform). These are the largest, motile phagocytes. They engulf bacteria and cellular debris. They differentiate into macrophages, when they enter the connective tissues.
Blood platelets (Thrombocytes) :
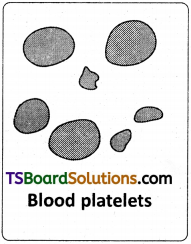
These are colourless non- nucleated, round or oval biconvex discs. Number of platelets per cubic mm of blood is about 2,50,000 – 4,50,000. They are formed from giant megakaryocytes produced in the red bone marrow by fragmentation. The average life-span of blood platelets is about 5 to 9 days. They secrete thromboplastin and play an important role in blood clotting. They adhere to the damaged endothelial lining of capillaries and seal minor vascular openings.
![]()
Question 7.
Compare and contrast the three types of muscular tissues.
Answer:
Muscular tissue is mesodermal in origin except iris and ciliary body muscles which are ectodermal in origin. Muscles are 3 types- ‘Skeletal, smooth and cardiac muscles.
| Skeletal muscle | Smooth muscle | Cardiac muscle |
| 1. Otherwise called as volunatry or striated or striped muscle. | Otherwise called as unstriped or involuntary or visceral muscle. | Otherwise called as striped involuntary muscle. |
| 2. Long cylindrical unbranched multinucleated cell. | Arranged in layers /sheets. Spindle shaped uninucleate cell. | Short, cylindrical mononucleate or binucleate cells whose ends branch and form junctions with other cardiac muscle cells. |
| 3. Skeletal muscle usually works under the conscious control of an organism. | Smooth muscles do not work under the conscious control and so they are called involuntary muscles. | Cardiac muscles are also involuntary in function. However the rate of beat is regulated by an autonomic innervation and hormones like epinephrine/ adrenaline |
| 4. Contracts quickly and undergoes fatigue quickly. They are innervated by somatic nervous system. | Smooth muscles exhibit slow and prolonged contractions. They may remain contracted for long periods without fatigue. The contractions are under the control of autonomons nervous system. | Contractions are very fast. Cardiac muscle is highly resistant to fatigue because of numerous sarcosomes and many molecules of myoglobin. Intercalated discs are characteristic. |
| 5. They are always attached to bones to bring movements of the body. | They help in internal movements to regulate daily metabolic activities like digestion, micturition etc. | They help in pumping of blood by contraction (systole) and expansion (diastole) of heart and facilitate continuous “aerobic respiration”. |


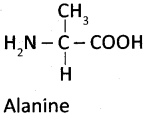
 is a zwitterionic form a neutral form due to equal positive and negative charges.