Telangana TSBIE TS Inter 2nd Year Economics Study Material 7th Lesson Tertiary Sector Textbook Questions and Answers.
TS Inter 2nd Year Economics Study Material 7th Lesson Tertiary Sector
Essay Questions
Question 1.
What is tertiary sector? Explain the importance of tertiary sector in India economy.
Answer:
In traditional setting, providing skills to satisfy human wants by barber, dhobi, carpenter, goldsmith, blacksmith etc., was considered as service. In modem economy, services became highly skilled and attractive, so, services ar contributing a major share to national income and in many countries, services are providing- employment to the major portion of labour force.
In modem economy the tertiary sector includes the following sub-sectors: trade, repair seirvices, hotels and restaurants, transport, storage, communication and services related to broadcasting, financial services, real estate, ownership of dwellings and professional services,
public administration, etc.
The services sector’s significance in the Indian economy has continued to increase as this sector now (2019) accounting for around 55 percent of total size of the economy and gross value added (GVA) growth, two-thirds of total FDI (2019) inflows and about 38 percent of total exports. The share of services sector now exceeds 50 percent of gross state value added in 15 out of the 33 states and UTs.
1) Contribution of Gross Value Added (GVA) :
In India the service sector has emerged as the major growth inducing sector. The share of service sector in gross value added (GVA) increased significantly from 49.4 percent in 2013-14 to 57.8 percent in 2019-20 (AE). The tertiary sector is assuning greater importance over the years with an average contgribution of about 58 per cent to the GVA, followed by the secondary and primary sectors with about 28 percent and 14 percent, respectively. However, the contribution of secondary sector (28.3% in 2019-20) and primary sector (13.9% in 2019-20) is declining over the years. According to Economic Survey of India-2019, contribution of major components of service sector in 2019-20 is as follows: trade, hotel, transport, storage, communication and services related to broadcasting is 18.1%; financial, real estate and professional services is 24.5%; and public administration, defence and other services is 15.2%.
2) Contribution To Employment :
Employment in modem service sector is highly skilled and high ranged earning one, especially, after the IT (Information Technology) revolution Average per Capita earning of service sector employees is very high when compared to employees of other sectors. The share of service sector in employment has increased from 17.3 per cent in 1950-51 to 26.5 percent in 2010 and further to 31.45 percent by 2018.
3) Exports :
The value of total service exports is increased from US $ 195.1 billion in 2017- 18 fo US $ 205.8 Billion in 2018-19 of which, software exports account for about 40 percent,’travel and transportation 23 percent and business services 19 percent, financial services 2 percent, communications 1 percent and insurance 1 percent. After deducting the value of services imports from balance of trade, the value of India’s favourable balance in services trade is US $ 81.9 billion in 2018-19.
4) Foreign Direct Investment (FPJ) in Service Seetor :
Gross foreign direct investment (FDI) equity inflows into service sector in 2018-19 was US$ 28,264 million. The share of service sector in gross FDI equity inflows into India is 64.6 percent in 2017-18 and 63.7 in 2018-19. An increase in net foreign direct investment (FDI) improves the Balance of Payments (BoP) position. The impressive improvement in balance of payment (BoP) position from March, 2014 to March, 2019 is mainly attributed to almost doubling of net FDI into the country during 2009-19. Net FDI inflows have continued to be buoyant in 2019-20.
Increasing FDI inflows in service sector is vital as it contributes over 60 per cent to the gross domestic product. Total FDI inflows to India from April, 2000 to September, 2019 are US $ 4.46 lakh million (Rs. 25.61)-lakh crore), nearly 50 percent of which belong to service sector.
![]()
Question 2.
Write about Tourism sector services in India.
Answer:
World Travel Organization defines tourism as “the activities of tourists travelling and staying in places outside thier usual environment for not more than one consecutive year for leisure, business and other purposes”. Indian government defines tourism as” a foreign passport holddr visiting and staying in India for more than a day but not more than a year for leisure, entertainment, business, medical purposes, religious, sports, conferences, seminars etc.” Tourism is a set of socio-economic activities carried out for tourists. There are two forms of tourism.
1) Domestic Tourism :
Domestic tourists are the residents of the country who travel within the geographical boundaries of their country. Traditionally, people use their vacations to visit religious places, pilgrimage centeres and historicasl places. The modem generation spend their vacations visiting wildlife sanctuaries, beaches, hill statiions, entertainment parks and resorts in the country.
2) International Tourism :
International tourists are the foreign passport holder visiting another country for business, leisure, fitness, wellnes, medical religious, spiritual, archaeo-logical, sports, conferences, seminars etc. They need visa, emigration and customs clearance of the government of the government of the country they are visiting.
The tourism sector, a major engine of growth, contributes to GVA, foreign exchange earnings and employment. In India, the tourism sector witnessed a strong performance from 2015 to 2017, with high growth in foreign tourist arrivals. However, foreign tourist arrivals growth has decelerated since then to 5.2 percent in 2018 and 2.7 percent in January-October 2019. This trend, however, is not unique to India, as the growth i international tourist arrivals globally also slowed from 7.1 percent in 2017 to 5.4 percent in 2018. Correspondingly!!, growth in foreign exchange earnings from tourism sector has slowed in 2018 and 2019 after registering strong growth until 2017, India has earned a total of US $ 24 billion foreign exchange during January-October 2019, with a growth of 2 percent.
About 7.68 million foreigners have visited India in 2014 and it increased to 10.56 millions by the year 2018. During the same period the number of international tourist arrivals (ITAs) to India increased from 13,11 millions to 17.42 millions while international tourist arrivals around the world increased from 1137 millions to 1401 millions. The share of India’s ITAs in world ITAs increased from 1.15 per cent in 2014 to 1.24 per cent by 2018. India’s rank in World’s ITAs Increased from 20th to 22nd India’s share in Asia Pacific’s ITAs increased from 4.86 percent to 5.1 percent. India’s rank in Asia Pacific’s ITAs increased from 8th to 7th.
India’s share in world tourism receipts increased from 1.57 percent to 1.97 percent (PE) India’s rank in world tourism receipts increased from 15th to 13th. India’s share in Asia Pacific’s tourism receipts has increased from 5.49 percent to 6.54 percent (PE). However, India’s rank in Asia Pacific’s tourism receipts remained same at 7 in 2014 and 2018.
State Level Sham of Tourism in GVA and Employment :
Looking at trends in tourism at the state level, the top five states attracting domestic tourists are Tamil Nadu, Uttar Pradesh, Karnataka, Andhra Pradesh and Maharashtra which accounted for nearly 65 percent of the total domestic tourist visits in the country in 2018. The top five states attractig foreign tourists were Tamil Nadu, Maharashtra, Uttar Pradesh, Delhi and Rajasthan, accounting for about 67 per cent of the total foreign tourist visits in the country in 2018.
The Ministry of Tourism along with the Natinal Council of Applied Economic Researcch (NCAER) prepared a tourism satellite account (TSA) following the methodology recommended by the UN World Tourism Organization. The state-wise share of tourism gross value added (TGVA) in state GVA and share of tourism employment in total state employment have been estimated in the draft report of Ministry of Tourism and NCEAR.
Government s Initiatives :
To facilitate international tourism, India introduced the e- Tourist Visa regime in September 2014 for 46 Countries. Prior to the launch of the scheme, the e-Visa facility was available for only 12 countries. The government further liberalized the visa regime in 2016, renaming it to e-Visa scheme with five sub-categories i.e. ‘e-Tourist Visa’, ‘e-Business Visa’, ‘e-Medical Visa’, ‘e-Conference Visa’ and ‘e-Medical Attendant Visa’. The e-Visa scheme is now available for 169 countries with valid entry through 28 designagted airports and 5 designated seaports. With this, foreign tourist arrivals to India on e-visas have increased from 4.45 lakh in 2015 to 23.69 lakh in 2018 recording nearly 21 percent year-on-year growth from the previous year.
Question 3.
Explain about IT-BPM (Information Technology and Business Process Management) services.
Answer:
Information Technology and Business Process Management (IT-BPM) Services :
Business process management (BPM) is a discipline involving any combination of modeling, automation, execution, control, measurement and optimization of business activity flows, in support of enterprise goals, spanning systems, employees, customers and partners wihtin and beyond the enterprise boundaries. The Indian IT-BPM industry has been the flag-bearer of India’s exports for the past two decades, as per Economic Survey of India, 2019, the exports from this industry is reached to about US$ 177 billion in March 2019.
The sector contributes significantly to the economy via employment growth and value addition. IT services constituted 51 percent of the IT-BPM sector in 2018-19, followed by software and engineering services (20.6 percent share) and BPM services (19.7 per cent share). Within the IT-BPM sector, IT services remained the dominant segment with about US$ 91 billion in revelues in 2018-19. Out of the IT sevices, digital revenues grew (year on year-YOY) more than 30 percent to reach US$ 33 billion.
Further, the IT-BPM sector can be divided into four major sub-sector as :
- IT services,
- software products and engineering services,
- BPM,
- hardware.
As per National Association of Software and Service Companies (NASSCOM), IT services occupy a major share with 51.2 percent, followed by software products and engineering services with 20.6 percent, BPM with 19.7 percent and hardware 8.5 percent in total value of IT- BPM services in 2018-19.
Exports of IT-BPM Sector :
A significant part (about 83 percent) of the IT-BPM industry continues to be export driven, with export revenues in excess of US$ 135 billion in 2018-19. During 2018-19, the revenue growth (YoY) for IT-BPM sector (excluding hardware)sofened to 6.8 percent from 8.2 percent in 2017-18. Out of the total US$ 135.5 billion in exports of the IT- BPM sector in 2018-19, IT services accounted for 55 percent of the exports, and BPM and software products and engineering services accounted for the remaining 45 percent with each accounting for almost half of the share. All three sub-sectors witnessed a pickup in export revenues in 2018-19, with IT services growing (YoY) by 7.3 percent, BPM services by 8.3 per cent and software products and engineering services by 11.2 percent.
Looking at export revenues by destination, USA accounts for the bulk of exports, amounting to US$ 84 billion, which is 62 percent of total IT-BPM exports (excluding hardware) in 2018-19. This is much larger than the share of exports going to UK, which is the second largest export market for IT-BPM services, with a share of around 17 percent. Europe (excluding UK) and Asia-Pacific account for 11.4 percent and 7.6 percent of the export earnings, respectively.
Government’s Initiatives :
A number of policy initiatives have been undertaken to drive innovation and technology adoption in the IT-BPM sector, including Start-up India and National Software Product Policy and removal of issues related to Angel tax, According to NASSCOM study, the Indian start-up ecosystem has been progressing, and is now the third largest in the world with 24 unicorns, though the gap with the largest (China: 206) and second largest (USA: 203) markets remains significant. Cities such as Bengaluru, Delhi-NCR, and Mumbai account for around 55 percent of the total startups in India.
![]()
Question 4.
Explain various kinds of transport systems in India.
Answer:
Transport sector helps the economy as the blood circulation system of a human body. Various means of transport are discussed as under.
1. Road Transport :
Road transport is the dominant mode of transportation in terms of its contribution in gross value added (GVA) and traffic share. The share of transport sector in the GVA for 2017-18 was about 4.77 percent, of which the share of road transport was the largest at 3.06 percent, followed by the share of he railways (0.75 percent), air transport (0.15 percent) and water transport (0.06 percent). Similarly, as per the National Transport Development Pollicy Colmmittee Report, as of 2011-12, road transport is estimated to handle 69 percent and 90 percent of the countrywide freight and pasenger traffic, respectively.
The Ministry of Road Transport and Highways (MoRTH) is mandated with the development and maintenance of road networks especially the national highways as well as the implementation of the motor vehicle act under which it formulate broad policies relating to road transport. As on March 31, 2018, India had a road network of about 59.64 lakh km. The total length of national highways was 1.32 lakh km as on March 1, 2019.
2. Railways :
Railway was nationalized in 1950. Indian Railways (IR) with over 68,000 route km is the third largest network in the world under single management. During the year 2018-19, Indian Railways carried 120 crore tonnes of freight and 840 crore passengers making it the world’s largest passenger carrier and 4th largest freight carrier. Railway safety is accorded the highest priority by Indian railways and steps are being undertaken on a continuous basis to prevent accidents and to enhance safety of the passengers.
Cleanliness and environmental Initiatives by Indian Railway :
Indian railways cover over 8,700 stations and carry around 230 lakh passengers daily with clientele of varied socio-economic backgrounds. Cleanliness is a continuous process and every endeavour is made to keep the stations and coaches in properly maintained and clean condition. Special cleanliness campaigns under SwaChh Bharat Abhiyan were launched by Indian Railways on October 2, 2014 and regualr intensive campaigns/drives have been organized since then.
Modernization of Stations :
Modernization/upgradation of railway stations in Indian railways is a continuous and on-going process. 1,253 stations have been indentified for development under Adarsh Station Scheme and are planned to be developed by 2019-320.
3. Air Transport :
India is the third largest domestic market for civil aviation in the world. Indan has 136 commercially-managed airports by Airports Authority of India (AAI) and 6 under public private partnetships (PPP) for operation, maintenance and development of airports. Air transport in India was nationalized in 1953 and India Airlines and Air India were established. Internal air transport Services were allocated to Indian Airlines and international services to Air India. The airline operations in India have scaled up their aircraft seat capacity from an estimated 0.07 annual seats per capita in 2013 to 0.12 in 2018. The comparable estimates for china, the second largest domestic market in the world, over this period were 0.33 in 2013 and 0.49 in 2018, while those of the United States of America, the largest domestic market, were 2.59 in 2013 and 2.95 in 2018.
Indian aviation re-established its resilience in the year 2019-20. A total of 43 airports have been operationalized since the scheme for operationalizing unserved airports (Udan) was taken up, of which 4 were done in FY 2019-20. On airport connectivity, India stood first along with 7 others (USA, China, Japan, UK, etc.) in the Global Competitiveness Report 2019 of World Economic Forum.
To ease the strain on existing airport capacities, 100 more airports are to be made operational by FY 2023-24. Besides using 46 idle airstrips, 16 private greenfield airports, 15 AAI airports, 31 heliports, and 12 waterdrowmes would be develolped. To continue with the high growth trajectory, the Govenment has been providing a congenial tenvironment so that the Indian cariers double their fleet from about 680 aircraft in 2019 to over 1,200 by FY 2023-24.
4. Water Transport :
Water transport connects canals, lakes, rivers, and backwaters wihtin the country. Shipping connects major ports of the country and the world. India with 5,000 km of river and canals has a vast potential for inland water transport, it is the cheapest and least polluting mode of transport. The five year plans discussed about integration of the major rivers, modemizaion of the boats and small ships and training skilled labour to develop inland water transport services. India has a coastal line of 7,156 km with 13 major ports and about 200 non-major ports. The share of shipping in total transport sector is 29%. Shipping is basically used to transport bulk transport item like petroleum products, coal etc.
As per Economic Survey of India-2019, India has a 0.9 percent share in world fleet as of January 2019. The total cargo capacity of Indian ports stood at 1,452.64 million tonnes per annum (MTPA) at the end of March 2019, more than doubling from 628.03 MTPA at the end of March 2010. Ports such as Paradip, Chennai, Vishakhapatnam, Deendayal (Kandla) and Jawaharlal Nehru port. JNPT had the highest cargo capacities as of March 2019. The total numbers of ships ownded by Indian companies stood at 1,414 as of August 2019, up from 1,040 om 2010. Growth in overall port traffic witnessed an acceleration between 2013-14 and 2016-17, but has decelerated since 2017-18.
Question 5.
Write an essay on the sources of energy in India.
Answer:
Energy Sector :
Energy is one of the most important building blocks in human development, and as such, acts as a key factor in determining the economic development of all the countries. Energy is available in many forms which is used either in production process or in consumption process. As per Economic Survey, 2019-20. India is the third largest energy cosumer in the world after USA and China in 2017 with a share of 5.8 per cent of the world’s primary energy consumption.
Sources of Energy :
Energy resources are all forms of fuels, used in the modem world, either for heating, the generation of electrical energy, or for other forms of energy conversion processes. The sources of energy can be divided into two subgroups:
I. Renewable Energy Resources :
Renewable energy is an energy that is produced from natural processes and continuously replenished.
Types of Renewable Energy :
1. Solar Energy :
The radiant light and heat energy from the sun is harnessed with the use of solar collectors. This collected solar energy is then used to provide light, heat and different other forms of electricity.
2. Wind Energy :
The energy we get from winds is known as wind energy. For this, windmills have been used for hundreds of years to pump out water from the ground. We use large tall wind turbines that allow winds to generate electricity. The natural airflow on the surface of the earth is used to run the wind turbines.
3. Hydroelectricity :
The kinetic energy from the flowing water is used to run the turbines which generate electricity. A tidal power which converts the energy of tides and wave power which captures the energy from the surface of the ocean waves for power generatin are other two forms of hydropower also have huge potential in electric power generation.
4. Geothermal Energy :
It is generated from the thermal energy which is stored in the earth. The heat energy is captured on sources such as hot springs and volcanoes and this heat is directly used by industries for heating the water and other purposes.
5. Bio-Energy :
This is derived from the biomass which is a type of biological material derived from living organisms. Biomass can be directly used via combustion to produce heat and indirectly it can be used to convert to bio-fuels. Biomass can be converted to other usable forms of energy such as transportation fuels like ethanol, biodiesel and methane gas.
According to Energy Statistics, 2020 (Minisry of Statistics and Programme Implementation, Gol), the total potential for renewable power generation in the country as on 31.03.2019 is estimated at 1097465 MW. This includes 68.25 percent of solar power, 27.54 percent of wind power and remaining is in the form of small hydro-power, biomass power etc.
The geographic distribution of the estimated potential of renewable power as on 31.03.2019 reveals that Rajasthan has the highest share of about 15% (162223 MW), followed by Gujarat with 11% share (122086 MW) and Maharashtra and Jammu & Kashmir with 10% share (113925MW and 112800 MW respectively), mainly on account of solar power potential except Gujarat where the share of wind power is the highest.
II. Non-Renewable Energy :
Non-renewable energy is that which does not renew itself at a sufficient rate for sustainable economic extraction in meaningful human time-frames. The non-renewable energy is energy from fossil fuels such as coal, crude oil; natural gas and uranium.
(A) Fossil Fuels: Fossil fuels are formed by the remains of animals and plants. Fossil fuel is divided into three categories as shown below :
1. Coal :
Coal deposits are mainly confined to eastern and south central parts of the country. The states of Jharkhand, Odisha, Chhattisgarh, West Bengal, Madhya Pradesh, Telangana and Maharashtra account for 98.09% of the total coal reserves in the country. The state of Jharkhand had the maximum share (25.88%) in the overall reserves of caol in the country. The state of Jharkhand had the maximum share (25.88%) in the overall reserves of coal in the country as on 31st March 2019 followed by Odisha (24.76%). Overall production of raw coal in India during the eyar 2018-19 was 730.4 million tonnes (MT) displaying a growth of 8.1 percent.
2. Crude Oil :
Due to excessive pressure, smaller organisms like zooplankton and algae are decomposed into oil. The estimated reserves of crude oil in India as on 31.03.2019 stood at 618.95 million tonnes (MT) against 594.69 million tonnes as on 31.03.2018. Geographical dis-tribution of crude oil indicates that the maximum reserves are in the Western Offshore (38%) followed by Assam (25.6%), whereas the maximum reserves of natural gas are in the Eastern Offshore(41%) followed by Western Offshore(23.4%).
3. Natural Gas :
The estimated reserves of natural gas in India as on 31.03.2019 stood at 1380.63 Billion Cubic Meters (BCM) as against 1139.57 BCM as on 31.03.2018.
(B) Nuclear Fuels :
The use of nuclear technology relying on fission requires naturally occurring radioactive material as fuel. Nuclear power provides about 6% of the world’s energy and 13-14% of the world’s elecricity.
1. Advantages of Non-Renewable Energy :
a) The non-renewable source of energy is affordable, for instance diesel and oil.
b) It is easily accessible and more compatible; and
c) the non-renewable source of energy is easy to store.
2. Disadvantages of Non-Renewable Energy :
a) The non-renewable energy cannot be replaced once their energy source is used up,
b) The by products of non-renewable energy cause environmental damages,
c) It also increases greenhouse gases.
Conventional and Non-Conventional Sources of Energy :
Energy resources can also be classified as conventional and non-conventional energy resources. The conventional sources of energy include firewood, straw, dried dung, coal, crude oil and natural gas, Thermal energy and hydro-power are conventional energy resources. Where as non-conventional sources of energy include solar energy, wind energy, tidal energy, geothermal energy, nuclear energy and bio-energy.
![]()
Question 6.
Write about Telecom sector services.
Answer:
Telecom Sector :
The science and technology of communication at a distance by transmission of electrical impulses, electromagnetic waves, or optical pulses, as by telephone, radio, television, or computer network is called Telecom sector. Total telephone connections in India grew by 18.8 percent from 9,961 lakhs in 2014-2015 to 11,834 laksh in 2018-19. As on 30 September 2019, the total subscription stood at 11,943 lakhs of which 5,147 lakhs connections were in the rural areas and 6,796 lakhs in the urban areas. Landline telephone connections were at 206 lakh while the number of wireless telephone connections stood at 11,736 lakh at the end of September 2019. The wireless telephony now constitutes 98.27 percent of all subscriptions whereas share of landline telephones now stands at only 1.73 percent.
The overall teledensity in India sands at 90.45 percent, the rural teledensity being 57.35 per cent and urban teledensity being 160.71 percent at the end of September 2019. The private sector dominates with a share of 88.81 per cent (10,606 lakh connections) at the end of September, 2019 while the share of public sector was 11.19 per cent (1,336 lakhs connections). Internal and broadband penetration in India has kept a rapid pace. The number of internet subscribers (both broadband and narrowband put together) stood at 6,653 lakhs at the end of June 2019 as compared to 2,516 lakhs in 2014.
The number of mobile internet subscribers was 6,436 lakhs at the end of June 2019 while the number of wireline internet subscribers was 217 lakh. Total broadband connections increased by about ten times, from 610 lakhs in 2014 to 5,946 lakhs in June 2019. This has accelerated the growth in internet traffic; with a data usage touching the highest ever level of 462 lakhs tera bytes in the year 2018.
Challenges :
There are 4 major players in the sector-3 in the private sector and Bharat Sanchar Nigam Limited (BSNL) and Mahanagar Telephone Nigam Limited (MTNL) in the public sector, operating in mutually exclusive zones. Since, 2016, the sector has witnessed substantial competition and price cutting by the Telecom Service Providers (TSPs) creating financial stress in the sector. As a result, the sector is experiencing consolidation. While some operators have filed for bankruptcy, others have merged, in their quest to improve viability. The price of data in the country is among the lowest in the world.
The average revenue per user (ARPU) for GSM based mobile services has also gone down substantially from Rs. 126 in June 2016 to Rs.74.30 in June 2019. BSNL and MTNL are also affected by the tariff war that has impacted their cash flow resulting in mounting losses. The government has drawn up a plan to revive these PSUs. The revival plan consists of several measures including reduction of staff cost through Voluntary Retirement Scheme, allotment of spectrum for 4G services, monetization of land/building, tower and fiber assets of BSNL/MTNL, debt restructuring through sovereign guarantee bonds and ‘in-principle’ approval for merger of BSNL and MTNL.
Telecom Infrastructure and Connectivity :
1) Bharat Net :
For achieving the goal of developing broadband highways as part of the digital India campaign, the government is implementing the flagship Bharat Net programme in a phased manner for providing broadband connecivity to all the 2.5 lakh gram panchayats (GPs) in the country. The project envisages an optimal mix of optical fibre, radio and satellite media.
2) Public Wi-Fi Access :
Public Wi-Fi hotspots ensure last-mile delivery of broadband to users and are much easier to scale than adding new mobile towers.
3) Towers and BTS :
The number of Mobile Base Transceiver Stations (BTS) saw a rise from 7.9 lakh in 2014 to 21.8 lakh (in July 2019) while Optical Fibre Cable increased from 7 lakh km to around 14 lakh km during the same period.
4) Project for Left Wing Extremism (LWE) Areas and North East Region :
The Department of Telecom executed a project for providing Mobile Services in 2,335 locations in Andhra Pradesh, Bihar, Chattisgarh, Jharkhand, Maharashtra, Madhya Pradesh, Odisha, Telangana, Uttar Pradesh and West Bengal, which are affected by Left Wing Extremism (LWE) with an outlay of Rs. 4,781 crores.
Short Answer Questions
Question 1.
Write about growth of service sector in India.
Answer:
In traditional setting, providing skills to satisfy human wants by barber, dhobi, carpenter, goldsmith etc. was considered as service. In modern economy the tertiary sector includes the following subsectors trade, repairs, hotels, restaurants, transport storage communication, banking, insurance and growth.
Growth of Service Sector :
Increase in production of goods and services during a particular period is considered as growth. Here, we are dealing with the growth of services. Not with standing the recent underperformance, the service sector continues to outperform agriculture and industry sectors, contributing around 58 percent to the total GVA. The growth of service sector can be understood by looking at Table given below
Growth of Tertiary Sector in India in Constant Prices (2011-12 Prices) (%)
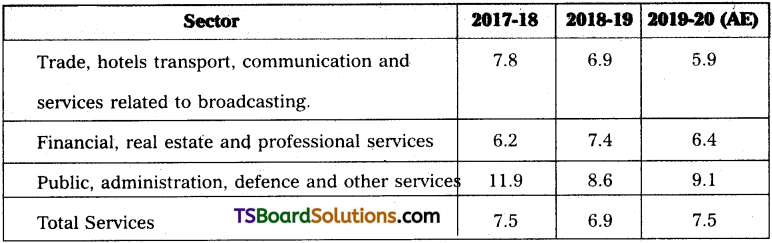
As per the above table it is evident that the annual growth of service sector in India is around 7 percent during the period from 2017-18 to 2019-20 in constant prices. Growth of service sector is 7.5 percent in 2017-18, 6.9 percent in 2018-19 and 7.5 percent in 2019-20. Within services, the growth of trade, hotels, transport, communication and services related to broadcasting decreased from 7.8 percent in 2017-18 to 5.9 percent in 2019-20. The growth rate of financial, real estate and professional services moderately increased from 6.2 per cent in 2017-18 to 6.4 per cent in 2019-20. The growth rate of public administration, defense and other services decreased from 11.9 percent in 2017-18 to 9.1 percent in 2019-20.
![]()
Question 2.
Analyse trends in growth rates and performance of key sub-sectors of services sector.
Answer:
Services Sector Performance at the State and UT Level :
The share of services sector in Gross State Value Added (GSVA) is highest in union territory Chandigarh followed by Delhi. In the case of states, we can see highest share of services sector in GSVA in Karnataka followed by Manipur, Telangana and Kerala. In contrast, the share of services in GSVA in 2018-19 is lowest in Sikkim followed by Gujarat, Madhya Pradesh and Chattisgarh.
With respect to growth rate of service sector, the average annual growth of service sector from 2014-15 to 2018-19 is highest in newly formed state of Telangana with 11.2 percent followed by Karnataka 10.5 percent and Andhra Pradesh 9.8 percent. The lowest annual average growth is recorded in Tripura at 3.0 percent followed by Sikkim 4.4 percent and Nagaland 4.9 percent. This was analysed in the following table.
Services Sector Performance at the State and Union Territory Level
| State | Services Sector State Share in GSVA* in 2018-19 (percent) | Services Sector 5-year Average Growth (percent YoY)** |
| Chandigarh* | 86.7 | 7.3 |
| Delhi | 84.1 | 8.8 |
| Andaman and Nicobar Islands* | 68.1 | 8.6 |
| Karnataka | 65.4 | 10.5 |
| Manipur” | 65.1 | 6.3 |
| Telangana | 64.7 | 11.2 |
| Kerala* | 62.7 | 6.4 |
| Bihar | 61.1 | 9.0 |
| Jammu & Kashmir* | 58.3 | 5.5 |
| Meghalaya* | 59.0 | 7.5 |
| Maharashtra* | 57.6 | 8.1 |
| West Bengal | 57.5 | 9.2 |
| Tamil Nadu | 54.2 | 6.9 |
| Nagaland* | 54.1 | 4.9 |
| Haryana | 50.8 | 9.2 |
| Uttar Pradesh | 48.8 | 7.7 |
| Puducherry | 48.5 | 6.0 |
| Assam* | 47.8 | 6.9 |
| Mizoram* | 46.8 | 7.8 |
| Punjab | 46.5 | 7.2 |
| Rajasthan | 45.0 | 7.3 |
| Jharkhand | 44.8 | 8.7 |
| Andhra Pradesh | 43.0 | 9.8 |
| Himachal Pradesh | 42.8 | 7.6 |
| Arunachal Pradesh* | 42.5 | 9.0 |
| Odisha | 41.8 | 8.4 |
| Uttarakhand | 40.5 | 9.5 |
| Tripura* | 39.7 | 3.0 |
| Goa | 38.0 | 8.4 |
| Chhattisgarh | 37.1 | 5.9 |
| Madhya Pradesh | 35.9 | 6.7 |
| Gujarat* | 35.7 | 8.6 |
| Sikkim | 26.8 | 4.4 |
Performance of India’s Key Sub-Sectors of Services :
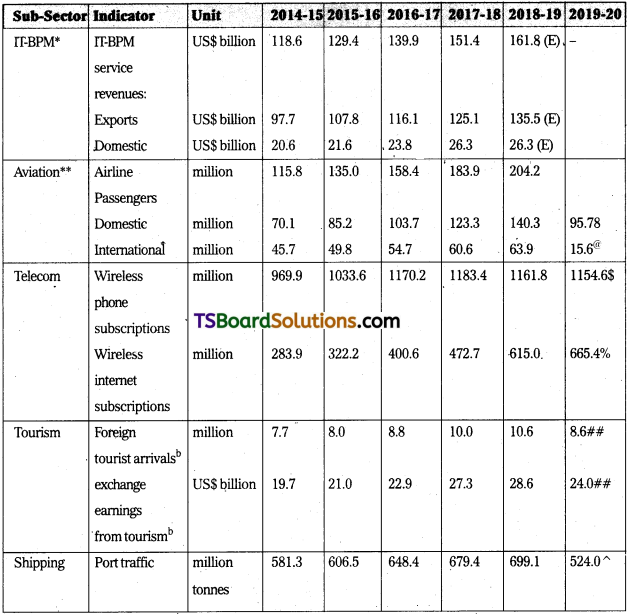
Most prominent sub-sectors of India’s services at present are business process management (BPM), aviation, telecom, tourism and shipping.
As per this table, revenue from BPM services increased from US$ 118.6 billion in 2014-15 to US$ 161.8 billion in 2018-19 of which value of exports increased from US$ 97.7 billion to 135.5 (estimated). During the same period number of airline passengers increased from 115.8 million to 135.5 million of which international passengers increased from 45.7 million to 63.9 million. The wireless phone subscriptions increased from 969.9 million to 1161.8 milion, wireless internet subscriptions increased from 283.3 million to 615 million. Foreign tourist arrivals increased the performance of these subsectors was analysed in the table given below
Performance of India’s Key Sub-Secotors of Services
Question 3.
Write about service sector contribution to GSVA (Gross State Value Added) and to employment in India.
Answer:
Tertiary Sector in a Modern Economy :
In modern economy the tertiary sector includes the following sub-sectors : trade, repair services, hotels and restaurants, transport (including railways, roadways, water, air ways and services incidental to transport), storage, communication and services related to broadcasting, financial services, real estate, ownership of dwellings and professional services, public administration, etc.
1) Contribution to Gross Value Added (GVA) :
In India the service sector has emerged as the major growth inducing sector. The share of service sector in gross value added (GVA) increased significantly from 49.4 percent in 2013-14 to 57.8 percent in 2019-20 (AE). The tertiary sector is assuming greater importance over the years with an average contribution of about 58 percent to the GVA, followed by the secondary and primary sectors with about 28 percent and 14 percent, respectively. However, the contribution of secondary sector (28.3% in 2019- 20) and primary sector (13.9% in 2019-20) is declining over the years. According to Economic Survey of India-2019, contribution of major components of service sector in 2019-20 is as follows: trade, hotel, transport, storage, communication and services related to broadcasting is 18.1%; financial, real estate and professional services is 24.5% ; and public administration, defence and other services is 15.2%.
2) Contribution to Employment :
Employment in modem service sector is highly skilled and high ranged earning one, especially, after the IT (Information Technology) revolution. Average per capita earning of service sector employees is very high when compared to employees of other sectors. The share of service sector in employment has increased from 17.3 percent in 1950-51 to 26.5 percent in 2010 and further to 31.45 percent by 2018.
Question 4.
What is national infrastructure pipeline 2020-25?
Answer:
Infrastructure :
The facilities which help for direct product activities are called infrastructure. E.g. : Transport, electricity, water, communication etc.„ are called economic infrastructure while education and health facilities are called social infrastructure. Inadequate transport infrastructure leads to bottlenecks both in the supply of raw materials as well as movement of finished goods to the market place. The price that farmers get for their produce is depressed if there is no connectivity through good quality rural roads, which in turn keeps rural incomes, depressed negating the fruits of high overall growth performance. For all these reasons, provision of adequate infrastructure is essential for and for making growth inclusive. India recently launched the National Infrastructure Pipeline for the period FY 2020-25.
National Infrastructure Pipeline 2020-2025 :
Investment in infrastructure is necessary for growth. To achieve the GDP of $5 trillion by 2024-25, India needs to spend about $1.4 trillion (Rs. 100 lakh crore) over these years on infrastructure. The challenges is to step-up annual infrastructure investment so that lack of infrastructure does not become a binding constraint to the growth of the Indian economy. To implement an infrastructure programme of this scale, it is important that projects are adequately prepared and launched. To draw up the National Infrastructure Pipeline (NIP) for each of the years from financial year 2019-20 to financial year 2024-25, an inter-ministerial task force was setup in September 2019.
NIP is expected to enable well-prepared infrastructure projects which will create jobs, improve ease of living and provide equitable access to infrastructure for all, thereby making growth more inclusive. The NIP has projected total infrastructure investment of Rs. 102 lakh crore during the period FY 2020 to 2025 in India. As per the NIP, central government (39 percent) and state government (39 percent) are expected to have equal share in funding of the projects followed by the Private sector(22 percent).
The NIP captures the infrastructure vision of the country for the period financial year 2020-2025. This is the first-ever exercise undertaken in the country. However, it is recognized that financing of the NIP would be a challenge. It is hoped that a bouquet of well-prepared projects would attract invesment from central and state governments, urban local bodies, banks and financial institution and private investors, both local and foreign.
![]()
Question 5.
What are the types of renewable energy sources?
Answer:
Types of Renewable Energy :
1. Solar Energy :
The radiant light and heat energy from the sun is harnessed with the use of solar collectors. This collected solar energy is then used to provide light, heat and different other forms of electricity.
2. Wind Energy :
The energy we get from winds is known as wind energy. For this, windmills have been used for hundreds of years to pump out water from the ground. We use large tall wind turbines that allow winds to generate electricity. The natural airflow on the surface of the earth is used to run the wind turbines.
3. Hydroelectricity :
The kinetic energy from the flowing water is used to run the turbines which generate electricity. A tidal power which converts the energy of tides and wave power which captures the energy from the surface of the ocean waves for power generation are other two forms of hydropower also have huge potential in electric power generation.
4. Geothermal Energy :
It is generated from the thermal energy which is stored in the earth. The heat energy is captured on captured on sources such as hot springs and volcanoes and this heat is directly used by industries for heating the water and other purposes.
5. Bio-Energy :
This is derived from the biomass which is a type of biological material derived from living organisms. Biomass can be directly used via combustion to produce heat and indirectly it can be used to convert to bio-fuels. Biomass can be converted to other usable forms of energy such as transportation fuels like ethanol, biodiesel and methane gas.
Question 6.
What are the types of non-renewable energy sources?
Answer:
Fossil Fuels :
Fossil fuels are formed by the remains of animals and plants. Fossil fuel is divided into three categories as shown below :
1. Coal :
Coal deposits are mainly confined to eastern and south central parts of the country. The states of Jharkhand, Odisha, Chhattisgarh, West Bengal, Madhya Pradesh, Telangana and Maharashtra account for 98.09% of the total coal reserves in the country. The state of Jharkhand had the maximum share (25.88%) in the overall reserves of caol in the country. The state of Jharkhand bad the maximum share (25.88%) in the overall reserves of coal in the country as on 31st March 2019 followed by Odisha (24.76%). Overall production of raw coal in India during the eyar 2018-19 was 730.4 million tonnes (MT) displaying a growth of 8.1 percent.
2. Crude Oil :
Due to excessive pressure, smaller organisms like zooplankton and algae are decomposed into oil. The estimated reserves of crude oil in India as on 31.03.2019 stood at 618.95 million tonnes (MT) against 594.69 million tonnes as on 31.03.2018. Geographical dis-tribution of crude oil indicates that the maximum reserves are in the Western Offshore (38%) followed by Assam (25.6%), whereas the maximum reserves of natural gas are in the Eastern Offshore(4I%) followed by Western Offshore(23.4%).
3. Natural Gas :
The estimated reserves of natural gas in India as on 31.03.2019 stood at 1380.63 Billion Cubic Meters (BCM)f as against 1139.57 BCM as on 31.03.2018.
Nuclear Fuels :
The use of nuclear technology relyig on fission requires naturally occur-ring radioactive material as fuel. Nuclear power provides about 6% of the world’s energy and 13-14% of the world’s elecricity.
1. Advantages of Non-Renewable Energy :
a) The non-renewable source of energy is affordable, for instance diesel and oil.
b) It is easily accessible and more compatible; and
c) The non-renewable source of energy is easy to store.
2. Disavantages fo Non-Renewable Energy :
a) The non-renewable energy cannot be replaced once their energy source is used up,
b) The by products of non-renewable energy cause environmental damages; and
c) It also increases greenhouse gases. .
Question 7.
Describe the structure of banking in India.
Answer:
Banking India :
The organized banking system broadly comprises of Reserve Bank of India, the monetary authority of the country, scheduled commercial banks and scheduled co: operative banks. Scheduled commercial arjd co-operative banks are those banks with a paid up capital of not less than Rs. 5 lakhs and are entered in the schedule B of RBI. They work in the interest of their depositors. Commercial banks work on the principle of profit motive. Co-operative banks are based on the cooperative principle of serving their own members.
Commercial banks mobilise savings. They lend these savings as short term investments. All commercial banks were established as private banks. 20 private banks with large deposits were nationalized in two phases in 1969 and 1980. Regional Rural Banks (RRB’s) were established in 1975. They are commercial banks but their area of operation is confined to rural areas. Their objective is to mobilise deposits and provide credit to small and marginal farmers, agricultural labourers, small entrepreneurs and artisans in rural areas.
Co-operative banking system is hierarchical in functioning. Under the central co-operative ebank all the state co-operative banks function. Under the state co-operative bank, district co-operative banks function. Primary co-operative societies are located in villages and work under District Co-operative Banks in ech district.
1. Reserve Bank of India (RBI) :
Reserve Bank of India (RBI) was established in 1935 and nationalized in 1949. As central bank of the country, RBI acts as bank of issue, banker to the government, banker’s bank, controller of credit, custodian of foreign exchange reserves and controlling authority of all financial institutions. It also concentrates to control inflation.
2. Commercial Banks :
Inl950-51, there were 430. In 2007 there were 172 commercial banks of which 27 were in public sector. State Bank of India is the leading public sector bank and had 6 associate banks. In April 2017, State Bank of India (SBI) merged five of its subsidiaries and Bharatiya Mahila Bank (BMB) with itself. In April, 2020 government implemented the merger of 10 public sector banks into four.
Question 8.
What are the major objectives of LIC? (Life Insurance Corporation)
Answer:
Life Insurance Corporation of India (LIC) :
The Mission of LIC is to explore and enhance the quality of life of people through financial security. The products and services provided should give ‘competitive returns’ to the policy holders and also ‘supply resources’ for economic development. LIC insurance plans include pension plans, health insurance, group insurance, unit linked insurance, children growth fund, etc. The endownment policies and money back policies cover risk as well as provide attractive bonus.
Major Objectives of LIC :
- To spread life insurance to rural areas and socially, economically backward sections of population covering risk of life at reasonable cost.
- To maximise savings by making insurance linked savings attractive.
- To provide security to policy holders money with higher returns.
- To invest policy holders money keeping in view of the advantage to investors and community.
- To maintain economy in operation and full realization of investors money.
![]()
Question 9.
Assess the importance of space sector.
Answer:
Space Sector :
In the recent years both developed and developing countries are investing funds on R&D activities related to space sector and India is no exception in this respect. India’s expenditure on space programme activities include design and development of a series of launch vehicles and related technologies, satellites and related technologies for earth observation, telecommunication and broadband, navigation, meteorology and space science, R&D in space sciences, and most recently, planetary exploration. In 2018, India spent about US$ 1.5 billion on space programmes, but India’s expenditure on space sector when compared to USA (US$ 19.5 billion), China (US$ 11 billion) and Russia (US$ 3.3 billion) was much less.
India’s space sector programmes include (a) satellite communication-with INSAT (Indian National Satellite) System/GSAT (Geosynchronous Satellites) system it addresses the needs for telecommunication, broadcasting and satellite-based broadband infrastructure in the country, (b) earth observation by using space-based information for weather forecasting, disaster man-agement, national resource mapping and governance, and (c) satellite-aided navigation including GAGAN and NavIC (Navigation with Indian Constellation).
GAGAN, a join project between Indian Space Research Organisaion (ISRO) and the Air-ports Authority of India (AAI), augments GPS coverage of the region to improve accuracy and integrity for civil aviation applications and better air traffic management over Indian airspace. NavIC, a regional navigation system has also been established for providing Position, Navigation and Timing (PNT) services.
Globally space activity is undergoing tremendous changes. A marked shift has been ob-served in engagement of space activities by government and private agencies. The government agencies are pursuing national needs and national security with space explorations while private agencies are investing in space exploration materials. ISRO identified following areas for attracting private investments in the space sector.
- Production of polar satellite launch vehicle (PSLV).
- Satellite integratin and assembl.
- Production of composite materials.
- Production of solid, liquid, cryogenic and semi-cryogenic propellants; and ‘
- production of electronic packages, testing and evaluation for avionics and satellite subsystems.
Very Short Answer Questions
Question 1.
Tertiary sector.
Answer:
It is the third major sector of the economy. It is the fastest growing sector in the economy with largest share in GDP. It supplies the supportive service to the primary and secondary sectors. So, it is the provider of supportive services required for economic development. It is called tertiary sector.
Question 2.
Infrastructure.
Answer:
The services which require for the development of the economy are known as Infrastructure. An unbrella term for service activities in the economy. These are of two types :
a) Economic Infrastructure. (Transport, Banking, insurance, energy, communication)
b) Social infrastructure. (Health education, generation).
Question 3.
Water transport.
Answer:
Water transport is the another important means of transport system for passenger and freight. Water transport in India is of two types. They are : 1. Inland water transport 2. International water transport.
![]()
Question 4.
Source of energy.
Answer:
Economic growth depends on the availability and use of energy. The higher the percapita income the higher is the energy consumption. The sources of energy can be divided into two types they are:
a) renewable sources of energy (solar, wind, Hydal ISO thermal and Bio energy
b) non-renewable energy sources (fossil fuel-coal, crude oils, natural gas and nuclear fuels-radio active material. Energy resources can also be classified as conventional (wood, straw, dried dung, coal, crude oil and natural gas, thermal energy and hydro power) non-conventional energy sources (wind energy, solar energy, tidal energy and bio energy)
Question 5.
Fossil Fuels.
Answer:
Fossil fuels are formed by the remains of animals and plants fossil fuel divided into three categories. 1) Coal 2) Crude oil 3) Natural gas.
Tertiary sector. Water transport. Fossil Fuels.
Question 6.
What is Bharat Net?
Answer:
For achieving the goal of developing broadband highways as part of the digital Indian campaign, the government is implementing the flagship Bharat Net Programme in a phased manner for providing broadband connectivity to all the 2.5 lakhs Gram Panchayats in the country. The project envisages an optimal mix of optical fibre, radio and satellite media.
Question 7.
Commercial banks.
Answer:
Commercial Banks :
In 1950-51, there were 430 banks in 2007, there were 172 commercial banks of which 27 were in public sector. State Bank of India is the leading public sector bank and had 6 associate banks. In April 2017, State Bank of India (SBI) merged five of its subsidiaries and Bharatiya Mahila Bank (BMB) with itself. In April, 2020 government implemented the merger of 10 public sector banks into four.
Question 8.
IRDA.
Answer:
Insurance Regulatory Development Authority of India (IRDA) :
IRDA Act was passed in 1999. IRDA was constituted as an autonomous body. It was given statutory status in 2000 to regulate and develop the insurance industry. IRDA has the duty to regulate, promote and ensure orderly growth of insurance and reassurance business.
LIC and GIC are the investment institutions to that mobilize large public savings. They use part of the funds for long term investment in corporate sector. Because of their large mobilizaion of contractual dealings they are very powerful in stock exchange.
![]()
Question 9.
GIC.
Answer:
It means General Insurance Corporation of India. It was established in the year 1972. It provides fire, marine, motor, health and other Insurances. General Insurance is also known as non-Life Insurance.