TS Inter 2nd Year Chemistry Notes

Students can make use of TSBIE Telangana TS Inter 2nd Year Chemistry Notes Pdf Download in English Medium and Telugu Medium to revise the chapters easily without having to worry about reading the textbooks. To understand all the crucial topics and concepts, nothing can be better than TS Intermediate 2nd Year Chemistry Notes made by expert teachers as per the latest syllabus.

Students can also check the TS Inter 2nd Year Chemistry Study Material and TS Inter 2nd Year Chemistry Important Questions for strong academic preparation.

TS Intermediate 2nd Year Chemistry Notes

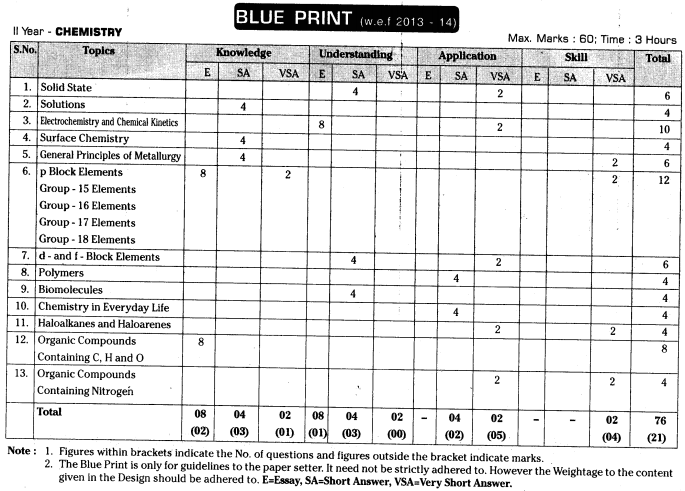
TS Inter 2nd Year Chemistry Weightage Blue Print

Students can study the TS Intermediate 2nd Year Chemistry Notes to improve their knowledge about all the important topics and concepts in their curriculum. By strictly following TS Inter 2nd Year Chemistry Notes students can clear all their doubts and proceed with their preparation process for the exam.

TS Inter 2nd Year Maths 2A Formulas PDF Download

Here we have created a list of Telangana TS Inter 2nd Year Maths 2A Formulas PDF Download for your reference to solve all important mathematical operations and questions. The importance of learning Maths 2A Formulas is that it helps us to solve problems easily. Use these TS Intermediate 2nd Year Maths 2A Formulas to solve problems creatively and you will automatically see an improvement in your mathematical skills.

Students can also check the TS Inter 2nd Year Maths 2A Study Material and TS Inter 2nd Year Maths 2A Important Questions for strong academic preparation.

TS Intermediate 2nd Year Maths 2A Formulas PDF Download

Here is a list of maths formulas for TS Inter 2nd Year Maths 2A subject.

  1. Maths 2A Complex Numbers Formulas
  2. Maths 2A De Moivre’s Theorem Formulas
  3. Maths 2A Quadratic Expressions Formulas
  4. Maths 2A Theory of Equations Formulas
  5. Maths 2A Permutations and Combinations Formulas
  6. Maths 2A Binomial Theorem Formulas
  7. Maths 2A Partial Fractions Formulas
  8. Maths 2A Measures of Dispersion Formulas
  9. Maths 2A Probability Formulas
  10. Maths 2A Random Variables and Probability Distributions Formulas

Here students will find TS Intermediate 2nd Year Maths 2A Formulas for each and every topic and also get an idea of how that equation was developed. The given formulas are helpful for students to solve problems based on them. These TS Inter 2nd Year Maths 2A Formulas will be extremely helpful for students to be able to solve questions more accurately and quickly.

TS Inter 2nd Year Maths 2B Formulas PDF Download

Here we have accumulated a list of Telangana TS Inter 2nd Year Maths 2B Formulas PDF Download for the students who consider Mathematics subject as a nightmare and difficult to understand. The importance of learning Maths 2B Formulas is that it helps us to solve problems easily. If the students are confident with all the below-mentioned TS Intermediate 2nd Year Maths 2B Formulas, they can easily solve different variations of questions and get acquainted with the concepts better.

Students can also check the TS Inter 2nd Year Maths 2B Study Material and TS Inter 2nd Year Maths 2B Important Questions for strong academic preparation.

TS Intermediate 2nd Year Maths 2B Formulas PDF Download

The list of formulas are provided here for TS Inter 2nd Year Maths 2B subject.

  1. Maths 2B Circles Formulas
  2. Maths 2B System of Circles Formulas
  3. Maths 2B Parabola Formulas
  4. Maths 2B Ellipse Formulas
  5. Maths 2B Hyperbola Formulas
  6. Maths 2B Integration Formulas
  7. Maths 2B Definite Integrals Formulas
  8. Maths 2B Differential Equations Formulas

Here students will find TS Intermediate 2nd Year Maths 2B Formulas for each and every topic and also get an idea of how that equation was developed. Check out the above-given formulas that are crucial for solving problems and for exams. These TS Inter 2nd Year Maths 2B Formulas will be extremely helpful for students to be able to solve questions more accurately and quickly.

TS Inter 2nd Year Zoology Notes

Students can make use of TSBIE Telangana TS Inter 2nd Year Zoology Notes Pdf Download in English Medium and Telugu Medium to revise the chapters easily without having to worry about reading the textbooks. To understand all the crucial topics and concepts, nothing can be better than TS Intermediate 2nd Year Zoology Notes made by expert teachers as per the latest syllabus.

Students can also check the TS Inter 2nd Year Zoology Study Material and TS Inter 2nd Year Zoology Important Questions for strong academic preparation.

TS Intermediate 2nd Year Zoology Notes

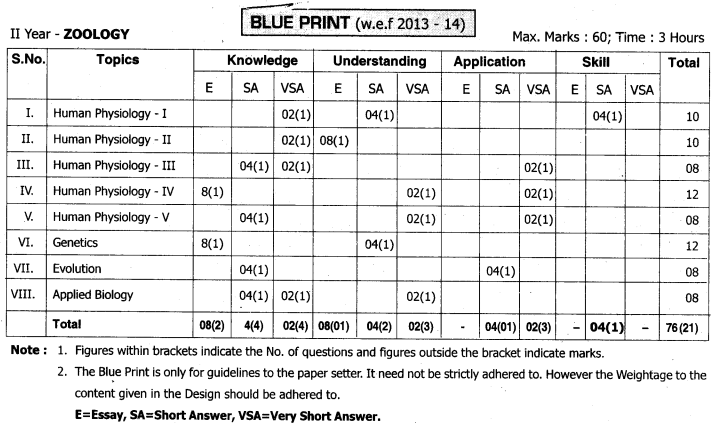
TS Inter 2nd Year Zoology Weightage Blue Print

Students can study the TS Intermediate 2nd Year Zoology Notes to improve their knowledge about all the important topics and concepts in their curriculum. By strictly following TS Inter 2nd Year Zoology Notes students can clear all their doubts and proceed with their preparation process for the exam.

TS Inter 2nd Year Physics Notes

Students can make use of TSBIE Telangana TS Inter 2nd Year Physics Notes Pdf Download in English Medium and Telugu Medium to revise the chapters easily without having to worry about reading the textbooks. To understand all the crucial topics and concepts, nothing can be better than TS Intermediate 2nd Year Physics Notes made by expert teachers as per the latest syllabus.

Students can also check the TS Inter 2nd Year Physics Study Material and TS Inter 2nd Year Physics Important Questions for strong academic preparation.

TS Intermediate 2nd Year Physics Notes

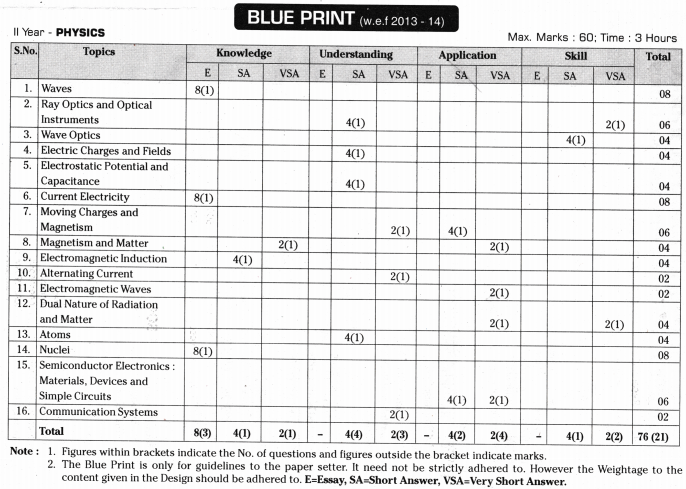
TS Inter 2nd Year Physics Weightage Blue Print

Students can study the TS Intermediate 2nd Year Physics Notes to improve their knowledge about all the important topics and concepts in their curriculum. By strictly following TS Inter 2nd Year Physics Notes students can clear all their doubts and proceed with their preparation process for the exam.

TS Inter 2nd Year Chemistry Study Material Telangana | TS Intermediate 2nd Year Chemistry Textbook Solutions Pdf

Here you will find Telangana TSBIE State Board Syllabus TS Inter 2nd Year Chemistry Study Material Pdf free download, TS Intermediate 2nd Year Chemistry Textbook Solutions Questions and Answers in English Medium and Telugu Medium according to the latest exam curriculum. The chapter-wise TS Inter 2nd Year Study Material will help the students in understanding the concept behind each question in a detailed way.

Students can check the TS Inter 2nd Year Chemistry Syllabus & TS Inter 2nd Year Chemistry Important Questions for strong academic preparation. Students can use TS Inter 2nd Year Chemistry Notes as a quick revision before the exam.

TS Intermediate 2nd Year Chemistry Study Material Pdf Download | TS Inter 2nd Year Chemistry Textbook Solutions Telangana

TS Inter 2nd Year Chemistry Weightage Blue Print 2022-2023

TS Inter 2nd Year Chemistry Weightage Blue Print

TS Inter 2nd Year Chemistry Syllabus

Telangana TS Intermediate 2nd Year Chemistry Syllabus

TELANGANA STATE BOARD OF INTERMEDIATE EDUCATION, HYDERABAD
Chemistry-II
Syllabus (w.e.f. 2013-14)

Chapter 1: SOLID STATE
1.1 General characteristics of solid state 1.2 Amorphous and crystalline solids 1.3 Classification of crystalline solids based on different binding forces (molecular, ionic, metallic and covalent solids) 1.4 Probing the structure of solids: X-ray crystallography 1.5 Crystal lattices and unit cells, Bravais lattices primitive and centred unit cells 1.6 Number of atoms in a unit cell (primitive, body centred and face centred cubic unit cell)1.7 Close packed structures: Close packing in one dimension, in two dimensions and in three dimensions- tetrahedral and octahedral voids- formula of a compound and number of voids filled- locating tetrahedral and octahedral voids 1.8 Packing efficiency in simple cubic, bcc and in hcp, ccp lattice. 1.9 Calculations involving unit cell dimensions-density of the unit cell. 1.10 Imperfections in solids-types of point defects-stoichiometric and non-stoichiometric defects 1.11 Electrical properties-conduction of electricity in metals, semiconductors and insulators- band theory of metals 1.12 Magnetic properties.

Chapter 2: SOLUTIONS
2.1 Types of solutions 2.2 Expressing concentration of solutions-mass percentage, volume percentage, mass by volume percentage, parts per million, mole fraction, molarity and molality 2.3 Solubility: Solubility of a solid in a liquid, solubility of a gas in a liquid, Henry’s law 2.4 Vapour pressure of liquid solutions: vapour pressure of liquid-liquid solutions. Raoult’s law as a special case of Henry’s law -vapour pressure of solutions of solids in liquids 2.5 Ideal and non-ideal solutions 2.6 Colligative properties and determination of molar mass-relative lowering of vapour pressure-elevation of boiling point-depression of freezing point-osmosis and osmotic pressure-reverse osmosis and water purification. 2.7 Abnormal molar masses-van’t Hoff factor.

Chapter 3: ELECTROCHEMISTRY AND CHEMICAL KINETICS
ELECTROCHEMISTRY
3.1 Electrochemical cells 3.2 Galvanic cells measurement of electrode potentials 3.3 Nernst equation-equilibrium constant from Nernst equation- electrochemical cell and Gibbs energy of the cell reaction 3.4 Conductance of electrolytic solutions-measurement of the conductivity of ionic solutions-variation of conductivity and molar conductivity with concentration-strong electrolytes and weak electrolytes-applications of Kohlrausch’s law 3.5 Electrolytic cells and electrolysis: Faraday’s laws of electrolysis-products of electrolysis 3.6 Batteries: primary batteries and secondary batteries 3.7 Fuel cells 3.8 Corrosion of metals-Hydrogen economy
CHEMICAL KINETICS
3.9 Rate of a chemical reaction 3.10 Factors influencing rate of a reaction: dependence of rate on concentration- rate expression and rate constant- order of a reaction, molecularity of a reaction 3.11 Integrated rate equations-zero order reactions-first order reactions- half life of a reaction 3.12 Pseudo first order reaction 3.13 Temperature dependence of the rate of a reaction -effect of catalyst 3.14 Collision theory of chemical reaction rates.

Chapter 4: SURFACE CHEMISTRY
4.1 Adsorption and absorption: Distinction between adsorption and absorption-mechanism of adsorption-types of adsorption-characteristics of physisorption-characteristics of chemisorptions-adsorption isotherms- adsorption from solution phase-applications of adsorption 4.2 Catalysis: Catalysts, promoters and poisons-auto catalysis- homogeneous and heterogeneous catalysis- adsorption theory of heterogeneous catalysis-important features of solid catalysts: (a) activity (b) selectivity-shape-selective catalysis by zeolites- enzyme catalysis-characteristics and mechanism-catalysts in industry 4.3 Colloids 4.4 Classification of colloids: Classification based on physical state of dispersed phase and dispersion medium- classification based on nature of interaction between dispersed phase and dispersion medium- classification based on type of particles of the dispersed phase- multi molecular, macromolecular and associated colloids-cleansing action of soaps-preparation of colloids-purification of colloidal solutions- properties of colloidal solutions: Tyndal effect, colour,Brownian movement-charge on colloidal particles, electrophoresis 4.5 Emulsions 4.6 Colloids Around us- application of colloids.

Chapter 5: GENERAL PRINCIPLES OF METALLURGY
5.1 Occurance of metals 5.2 Concentration of ores-levigation, magnetic separation, froth floatation, leaching 5.3 Extraction of crude metal from concentrated ore-conversion to oxide, reduction of oxide to the metal 5.4 Thermodynamic principles of metallurgy-Ellingham diagram-limitations-applications-extraction of iron, copper and zinc from their oxides 5.5 Electrochemical principles of metallurgy 5.6 Oxidation and reduction 5.7 Refining of crude metal-distillation, liquation poling, electrolysis, zone refining and vapour phase refining 5.8 Uses of aluminium, copper, zinc and iron

Chapter 6: p-BLOCK ELEMENTS
GROUP-15 ELEMENTS
6.1 Occurance- electronic configuration, atomic and ionic radii, ionisation energy, electronegativity, physical and chemical properties 6.2 Dinitrogen-preparation, properties and uses 6.3 Compounds of nitrogen-preparation and properties of ammonia 6.4 Oxides of nitrogen 6.5 Preparation and properties of nitric acid 6.6 Phosphorous-allotropic forms 6.7 Phosphine-preparation and properties 6.8 Phosphorous halides 6.9 Oxoacids of phosphorous
GROUP-16 ELEMENTS
6.10 Occurance- electronic configuration, atomic and ionic radii, ionisation enthalpy, electron gain enthalpy, electronegativity, physical and chemical properties 6.11 Dioxygen-preparation, properties and uses 6.12 Simple oxides 6.13 Ozone-preparation, properties, structure and uses 6.14 Sulphur-allotropic forms 6.15 Sulphur dioxide-preparation, properties and uses 6.16 Oxoacides of sulphur 6.17 Sulphuric acid-industrial process of manufacture, properties and uses
GROUP-17 ELEMENTS
6.18 Occurance, electronic configuration, atomic and ionic radii, ionisation enthalpy, electron gain enthalpy, electronegativity, physical and chemical properties 6.19 Chlorine-preparation, properties and uses 6.20 Hydrogen chloride- preparation, properties and uses 6.21 Oxoacids of halogens 6.22 Interhalogen compounds
GROUP-18 ELEMENTS
6.23 Occurance, electronic configuration, ionization enthalpy, atomic radii electron gain enthalpy, physical and chemical properties(a) Xenon-fluorine compounds-XeF2, XeF4 and XeF6 -preparation, hydrolysis and formation of fluoro anions-structures of XeF2, XeF4 and XeF6 (b) Xenon-oxygen compounds XeO3 and XeOF4 – their formation and structures

Chapter 7: d AND f BLOCK ELEMENTS &COORDINATION COMPOUNDS
d AND f BLOCK ELEMENTS
7.1 Position in the periodic table 7.2 Electronic configuration of the d-block elements 7.3 General properties of the transition elements (d-block) -physical properties, variation in atomic and ionic sizes of transition series, ionisation enthalpies, oxidation states, trends in the M2+/M and M3+/M2+ standard electrode potentials, trends in stability of higher oxidation states, chemical reactivity and EJ values, magnetic properties, formation of coloured ions, formation of complex compounds, catalytic properties, formation of interstitial compounds, alloy formation 7.4 Some important compounds of transition elements-oxides and oxoanions of metals-preparation and properties of potassium dichromate and potassium permanganate-structures of chromate, dichromate, manganate and permanganate ions 7.5 Inner transition elements(f-block)-lanthanoids- electronic configuration-atomic and ionic sizes- oxidation states- general characteristics 7.6 Actinoids-electronic configuration atomic and ionic sizes, oxidation states, general characteristics and comparision with lanthanoids 7.7 Some applications of d and f block elements.
COORDINATION COMPOUNDS
7.8 Werner’s theory of coordination compounds 7.9 Definitions of some terms used in coordination compounds 7.10 Nomenclature of coordination compounds-IUPAC nomenclature 7.11 Isomerism in coordination compounds-(a)Stereo isomerism-Geometrical and optical isomerism (b)Structural isomerism-linkage, coordination, ionisation and solvate isomerism 7.12 Bonding in coordination compounds. (a)Valence bond theory -magnetic properties of coordination compounds-limitations of valence bond theory (b) Crystal field theory (i) Crystal field splitting in octahedral and tetrahedral coordination entities (ii) Colour in coordination compounds-limitations of crystal field theory 7.13 Bonding in metal carbonyls 7.14 Stability of coordination compounds 7.15 Importance and applications of coordination compounds.

Chapter 8: POLYMERS
8.1 Classification of Polymers -Classification based on source, structure, mode of polymerization, molecular forces and growth polymerization 8.2 Types of polymerization reactions-addition polymerization or chain growth polymerization-ionic polymerization, free radical mechanism-preparation of addition polymers-polythene, teflon and poly acrylonitrile-condensation polymerization or step growth polymerization-polyamides-preparation of Nylon 6,6 and nylon 6-poly esters-terylene-bakelite, melamine, formaldehyde polymer- copolymerization-Rubber-natural rubber-vulcanisation of rubber-Synthetic rubbers-preparation of neoprene and buna-N 8.3 Molecular mass of polymers-number average and weight average molecular masses-poly dispersity index (PDI) 8.4 Biodegradable polymers-PHBV, Nylon 2-nylon 6 8.5 Polymers of commercial importance-poly propene, polystyrene, polyvinyl chloride(PVC), urea-formaldehyde resin, glyptal, bakelite- their monomers, structures and uses.

Chapter 9: BIOMOLECULES
9.1 Carbohydrates – Classification of carbohydrates-Monosaccharides: preparation of glucose from sucrose and starch- Properties and structure of glucose- D,L and (+), (-) configurations of glucose- Structure of fructose Disaccharides: Sucrose- preparation, structure-Invert sugar- Structures of maltose and lactose-Polysaccharides: Structures of starch cellulose and glycogen- Importance of carbohydrates 9.2 Aminoacids: Natural aminoacids-classification of amino acids -structures and D and L forms-Zwitter ions Proteins: Structures, classification, fibrous and globular-primary, secondary, tertiary and quaternary structures of proteins- Denaturation of proteins 9.3 Enzymes: Enzymes, mechanism of enzyme action 9.4 Vitamins: Explanation-names- classification of vitamins – sources of vitamins-deficiency diseases of different types of vitamins 9.5. Nucleic acids: chemical composition of nucleic acids, structures of nucleic acids, DNA finger printing biological functions of nucleic acids 9.6 Hormones: Definition, different types of hormones, their production, biological activity, diseases due to their abnormal activities.

Chapter 10: CHEMISTRY IN EVERYDAY LIFE
10.1 Drugs and their classification: (a) Classification of drugs on the basis of pharmacological effect (b) Classification of drugs on the basis of drug action (c) Classification of drugs on the basis of chemical structure (d) Classification of drugs on the basis of molecular targets 10.2 Drug-Target interaction-Enzymes as drug targets(a) Catalytic action of enzymes (b) Drug-enzyme interaction Receptors as drug targets10.3 Therapeutic action of different classes of drugs: antacids, antihistamines, neurologically active drugs: tranquilizers, analgesics-non-narcotic, narcotic analgesics, antimicrobials-antibiotics, antiseptics and disinfectants- antifertility drugs 10.4 Chemicals in food-artificial sweetening agents, food preservatives, antioxidants in food 10.5 Cleansing agents-soaps and synthetic detergents.

Chapter 11: HALOALKANES AND HALOARENES
11.1 Classification and nomenclature 11.2 Nature of C-X bond 11.3 Methods of preparation: Alkyl halides and aryl halides-from alcohols, from hydrocarbons (a) by free radical halogenation -(b) by electrophilic substitution (c) by replacement of diazonium group(Sand-Meyer reaction) (d) by the addition of hydrogen halides and halogens to alkenes-by halogen exchange(Finkelstein reaction) 11.4 Physical properties-melting and boiling points, density and solubility 11.5 Chemical reactions: Reactions of haloalkanes (i)Nucleophilic substitution reactions (a) SN2 mechanism (b) SN1 mechanism (c) stereochemical aspects of nucleophilic substitution reactions – optical activity (ii) Elimination reactions (iii) Reaction with metals-Reactions of haloarenes: (i) Nucleophilic substitution (ii)Electrophilic substitution and (iii) Reaction with metals 11.6 Polyhalogen compounds: Uses and environmental effects of dichloro methane, trichloromethane, triiodomethane, tetrachloro methane, freons and DDT.

Chapter 12: ORGANIC COMPOUNDS CONTAINING C, H AND O
(Alcohols, Phenols, Ethers, Aldehydes, Ketones and Carboxylic acids) ALCOHOLS, PHENOLS AND ETHERS
12.1 Alcohols, phenols and ethers –classification 12.2 Nomenclature: (a) Alcohols, (b)phenols and (c)ethers 12.3 Structures of hydroxy and ether functional groups 12.4 Methods of preparation: Alcohols from alkenes and carbonyl compounds- Phenols from haloarenes, benzene sulphonic acid, diazonium salts, cumene 12.5 Physical propertics of alcohols and phenols 12.6 Chemical reactions of alcohols and phenols (i) Reactions involving cleavage of O-H bond-Acidity of alcohols and phenols, esterification (ii) Reactions involving cleavage of C-O bond-reactions with HX, PX3, dehydration and oxidation (iii) Reactions of phenols-electrophilic aromatic substitution, Kolbe’s reaction, Reimer – Tiemann reaction, reaction with zinc dust, oxidation 12.7 Commercially important alcohols (methanol, ethanol) 12.8 Ethers-Methods of preparation: By dehydration of alcohols, Williamson synthesis- Physical properties-Chemical reactions: Cleavage of C-O bond and electrophilic substitution of aromatic ethers.
ALDEHYDES AND KETONES
12.9 Nomenclature and structure of carbonyl group 12.10 Preparation of aldehydes and ketones-(1) by oxidation of alcohols (2) by dehydrogenation of alcohols (3) from hydrocarbons -Preparation of aldehydes (1) from acyl chlorides (2) from nitriles and esters (3) from hydrocarbons-Preparation of ketones (1) from acyl chlorides (2) from nitriles (3) from benzene or substituted benzenes 12.11 Physical properties of aldehydes and ketones 12.12 Chemical reactions of aldehydes and ketones-nucleophilic addition, reduction, oxidation, reactions due to -Hydrogen and other reactions (Cannizzaroreaction, electrophilic substitution reaction) 12.13 Uses of aldehydes and ketones.
CARBOXYLIC ACIDS
12.14 Nomenclature and structure of carboxyl group 12.15 Methods of preparation of carboxylic acids- (1)from primary alcohols and aldehydes (2) from alkylbenzenes (3) from nitriles and amides (4) from Grignard reagents (5) from acyl halides and anhydrides (6) from esters 12.16 Physical properties 12.17 Chemical reactions: (i) Reactions involving cleavage of OH bond-acidity, reactions with metals and alkalies (ii) Reactions involving cleavage of C-OH bond-formation of anhydride, reactions with PCl5, PCl3, SOCl2, esterification and reaction with ammonia (iii) Reactions involving -COOH group-reduction, decarboxylation (iv) Substitution reactions in the hydrocarbon part – halogenation and ring substitution 12.18 Uses of carboxylic acids.

Chapter 13: ORGANIC COMPOUNDS CONTAINING NITROGEN
I. AMINES
13.1 Structure of amines 13.2 Classification 13.3 Nomenclature 13.4 Preparation of amines: reduction of nitro compounds, ammonolysis of alkyl halides, reduction of nitriles, reduction of amides, Gabriel phthalimide synthesis and Hoffmann bromamide degradation reaction. 13.5 Physical properties13.6 Chemical reactions: basic character of amines, alkylation, acylation, carbyl amine reaction, reaction with nitrous acid, reaction with aryl sulphonyl chloride, electrophilic substitution of aromatic amines-bromination, nitration and sulphonation.
II. DIAZONIUM SALTS
13.7 Methods of preparation of diazonium salts (by diazotization) 13.8 Physical properties 13.9 Chemical reactions: Reactionsinvolvin.
III. CYANIDES AND ISOCYANIDES
13.11 Structure and nomenclature of cyanides and isocyanides 13.12 Preparation, physical properties and chemical reactions of cyanides and isocyanides.

We hope this TS Intermediate 2nd Year Chemistry Study Material Pdf Download in English Medium and Telugu Medium will be useful for students to attain the right approach for precisely answering the textbook questions. If there is any trouble in grasping the concepts related to TS Inter 2nd Year Chemistry Textbook Solutions Telangana, drop your questions in the comment and we will get back to you with a solution in time.

TS Inter 2nd Year Physics Study Material Telangana | TS Intermediate 2nd Year Physics Textbook Solutions Pdf

Here you will find Telangana TSBIE State Board Syllabus TS Inter 2nd Year Physics Study Material Pdf free download, TS Intermediate 2nd Year Physics Textbook Solutions Questions and Answers in English Medium and Telugu Medium according to the latest exam curriculum. The chapter-wise TS Inter 2nd Year Study Material will help the students in understanding the concept behind each question in a detailed way.

Students can check the TS Inter 2nd Year Physics Syllabus & TS Inter 2nd Year Physics Important Questions for strong academic preparation. Students can use TS Inter 2nd Year Physics Notes as a quick revision before the exam.

TS Intermediate 2nd Year Physics Study Material Pdf Download | TS Inter 2nd Year Physics Textbook Solutions Telangana

TS Inter 2nd Year Physics Weightage Blue Print 2022-2023

TS Inter 2nd Year Physics Weightage Blue Print

TS Inter 2nd Year Physics Syllabus

Telangana TS Intermediate 2nd Year Physics Syllabus

TELANGANA STATE BOARD OF INTERMEDIATE EDUCATION, HYDERABAD
PHYSICS-II
Syllabus (w.e.f. 2013-14)

Chapter ONE: WAVES

  • 1.1 INTRODUCTION
  • 1.2 Transverse and longitudinal waves
  • 1.3 Displacement relation in a progressive wave
  • 1.4 The speed of a traveling wave
  • 1.5 The principle of superposition of waves
  • 1.6 Reflection of waves
  • 1.7 Beats
  • 1.8 Doppler effect

Chapter TWO: RAY OPTICS AND OPTICAL INSTRUMENTS

  • 2.1 INTRODUCTION
  • 2.2 Reflection of Light by Spherical Mirrors
  • 2.3 Refraction
  • 2.4 Total Internal Reflection
  • 2.5 Refraction at Spherical Surfaces and by Lenses
  • 2.6 Refraction through a Prism
  • 2.7 Dispersion by a Prism
  • 2.8 Some Natural Phenomena due to Sunlight
  • 2.9 Optical Instruments

Chapter THREE: WAVE OPTICS

  • 3.1 Introduction
  • 3.2 Huygens Principle
  • 3.3 Refraction and reflection of plane waves using Huygens Principle
  • 3.4 Coherent and Incoherent Addition of Waves
  • 3.5 Interference of Light Waves and Young’s Experiment
  • 3.6 Diffraction
  • 3.7 Polarisation

Chapter FOUR: ELECTRIC CHARGES AND FIELDS

  • 4.1 INTRODUCTION
  • 4.2 Electric Charges
  • 4.3 Conductors and Insulators
  • 4.4 Charging by Induction
  • 4.5 Basic Properties of Electric Charge
  • 4.6 Coulomb’s Law
  • 4.7 Forces between Multiple Charges
  • 4.8 Electric Field
  • 4.9 Electric Field Lines
  • 4.10 Electric Flux
  • 4.11 Electric Dipole
  • 4.12 Dipole in a Uniform External Field
  • 4.13 Continuous Charge Distribution
  • 4.14 Gauss’s Law
  • 4.15 Application of Gauss’s Law

Chapter FIVE: ELECTROSTATIC POTENTIAL AND CAPACITANCE

  • 5.1 INTRODUCTION
  • 5.2 Electrostatic Potential
  • 5.3 Potential due to a Point Charge
  • 5.4 Potential due to an Electric Dipole
  • 5.5 Potential due to a System of Charges
  • 5.6 Equipotential Surfaces
  • 5.7 Potential Energy of a System of Charges
  • 5.8 Potential Energy in an External Field
  • 5.9 Electrostatics of Conductors
  • 5.10 Dielectrics and Polarisation
  • 5.11 Capacitors and Capacitance
  • 5.12 The Parallel Plate Capacitor
  • 5.13 Effect of Dielectric on Capacitance
  • 5.14 Combination of Capacitors
  • 5.15 Energy Stored in a Capacitor
  • 5.16 Van de Graaff Generator

Chapter SIX: CURRENT ELECTRICITY

  • 6.1 INTRODUCTION
  • 6.2 Electric Current
  • 6.3 Electric Currents in Conductors
  • 6.4 Ohm’s law
  • 6.5 Drift of Electrons and the Origin of Resistivity
  • 6.6 Limitations of Ohm’s Law
  • 6.7 Resistivity of various Materials
  • 6.8 Temperature Dependence of Resistivity
  • 6.9 Electrical Energy, Power
  • 6.10 Combination of Resistors — Series and Parallel
  • 6.11 Cells, emf, Internal Resistance
  • 6.12 Cells in Series and in Parallel
  • 6.13 Kirchhoff’s Laws
  • 6.14 Wheatstone Bridge
  • 6.15 Meter Bridge
  • 6.16 Potentiometer

Chapter SEVEN: MOVING CHARGES AND MAGNETISM

  • 7.1 INTRODUCTION
  • 7.2 Magnetic Force
  • 7.3 Motion in a Magnetic Field
  • 7.4 Motion in Combined Electric and Magnetic Fields
  • 7.5 Magnetic Field due to a Current Element, Biot-Savart Law
  • 7.6 Magnetic Field on the Axis of a Circular Current Loop
  • 7.7 Ampere’s Circuital Law
  • 7.8 The Solenoid and the Toroid
  • 7.9 Force between Two Parallel Currents, the Ampere
  • 7.10 Torque on Current Loop, Magnetic Dipole
  • 7.11 The Moving Coil Galvanometer

Chapter EIGHT: MAGNETISM AND MATTER

  • 8.1 INTRODUCTION
  • 8.2 The Bar Magnet
  • 8.3 Magnetism and Gauss’s Law
  • 8.4 The Earth’s Magnetism
  • 8.8 Magnetisation and Magnetic Intensity
  • 8.6 Magnetic Properties of Materials
  • 8.7 Permanent Magnets and Electromagnets

Chapter NINE: ELECTROMAGNETIC INDUCTION

  • 9.1 INTRODUCTION
  • 9.2 The Experiments of Faraday and Henry
  • 9.3 Magnetic Flux
  • 9.4 Faraday’s Law of Induction
  • 9.5 Lenz’s Law and Conservation of Energy
  • 9.6 Motional Electromotive Force
  • 9.7 Energy Consideration: A Quantitative Study
  • 9.8 Eddy Currents
  • 9.9 Inductance
  • 9.10 AC Generator

Chapter TEN: ALTERNATING CURRENT

  • 10.1 INTRODUCTION
  • 10.2 AC Voltage Applied to a Resistor
  • 10.3 Representation of AC Current and Voltage by Rotating Vectors — Phasors
  • 10.4 AC Voltage Applied to an Inductor
  • 10.5 AC Voltage Applied to a Capacitor
  • 10.8 AC Voltage Applied to a Series LCR Circuit
  • 10.7 Power in AC Circuit: The Power Factor
  • 10.8 LC Oscillations
  • 10.9 Transformers

Chapter ELEVEN: ELECTROMAGNETIC WAVE

  • 11.1 INTRODUCTION
  • 11.2 Displacement Current
  • 11.3 Electromagnetic Waves
  • 11.4 Electromagnetic Spectrum

Chapter TWELVE: DUAL NATURE OR RADIATION AND MATTER

  • 12.1 Introduction
  • 12.2 Electron Emission
  • 12.3 Photoelectric Effect
  • 12.4 Experimental Study of Photoelectric Effect
  • 12.5 Photoelectric Effect and Wave Theory of Light
  • 12.6 Einstein’s Photoelectric Equation: Energy Quantum of Radiation
  • 12.7 Particle Nature of Light: The Photon
  • 12.8 Wave Nature of Matter
  • 12.9 Davisson and Germer Experiment

Chapter THIRTEEN: ATOMS

  • 13.1 INTRODUCTION
  • 13.2 Alpha-particle Scattering and Rutherford’s Nuclear Model of Atom
  • 13.3 Atomic Spectra
  • 13.4 Bohr Model of the Hydrogen Atom
  • 13.5 The Line Spectra of the Hydrogen Atom
  • 13.6 DE Broglie’s Explanation of Bohr’s Second Postulate of Quantisation

Chapter FOURTEEN: NUCLEI

  • 14.1 INTRODUCTION
  • 14.2 Atomic Masses and Composition of Nucleus
  • 14.3 Size of the Nucleus
  • 14.4 Mass-Energy and Nuclear Binding Energy
  • 14.5 Nuclear Force
  • 14.6 Radioactivity
  • 14.7 Nuclear Energy

Chapter FIFTEEN: SEMICONDUCTOR ELECTRONICS: MATERIALS, DEVICES AND SIMPLE CIRCUITS

  • 15.1 INTRODUCTION
  • 15.2 Classification of Metals, Conductors and Semiconductors
  • 15.3 Intrinsic Semiconductor
  • 15.4 Extrinsic Semiconductor
  • 15.5 p-n Junction
  • 15.6 Semiconductor diode
  • 15.7 Application of Junction Diode as a Rectifier
  • 15.8 Special Purpose p-n Junction Diodes
  • 15.9 Junction Transistor
  • 15.10 Digital Electronics and Logic Gates
  • 15.11 Integrated Circuits

Chapter SIXTEEN: COMMUNICATION SYSTEMS

  • 16.1 INTRODUCTION
  • 16.2 Elements of a Communication System
  • 16.3 Basic Terminology Used in Electronic Communication Systems
  • 16.4 Bandwidth of Signals
  • 16.5 Bandwidth of Transmission Medium
  • 16.6 Propagation of Electromagnetic Waves
  • 16.7 Modulation and its Necessity
  • 16.8 Amplitude Modulation
  • 16.9 Production of Amplitude Modulated Wave
  • 16.10 Detection of Amplitude Modulated Wave

We hope this TS Intermediate 2nd Year Physics Study Material Pdf Download in English Medium and Telugu Medium will be useful for students to attain the right approach for precisely answering the textbook questions. If there is any trouble in grasping the concepts related to TS Inter 2nd Year Physics Textbook Solutions Telangana, drop your questions in the comment and we will get back to you with a solution in time.

TS Inter 2nd Year Study Material Telangana | TS Intermediate 2nd Year Textbook Solutions Pdf

Here students will find Telangana TSBIE State Board Syllabus TS Intermediate Inter 2nd Year Study Material Textbook Solutions Questions and Answers PDF Free Download in English Medium and Telugu Medium according to the latest exam curriculum. The curriculum has been designed in such a way that it helps them to grasp the concepts of the subject. These TS Intermediate 2nd Year Textbook Solutions will prove to be useful study tools during exam preparation.

TS Intermediate 2nd Year Study Material Pdf Download | TS Inter 2nd Year Textbook Solutions Telangana

Here is TS Intermediate 2nd Year Study Material to help students prepare and ace the TS Intermediate 2nd year exams.

TS Inter 2nd Year Study Material Pdf

TS Inter 2nd Year Important Questions

  • TS Inter 2nd Year Maths 2A Important Questions
  • TS Inter 2nd Year Maths 2B Important Questions
  • TS Inter 2nd Year Physics Important Questions
  • TS Inter 2nd Year Chemistry Important Questions
  • TS Inter 2nd Year Botany Important Questions
  • TS Inter 2nd Year Zoology Important Questions
  • TS Inter 2nd Year Political Science Important Questions
  • TS Inter 2nd Year Commerce Important Questions
  • TS Inter 2nd Year Accountancy Important Questions
  • TS Inter 2nd Year Economics Important Questions

TS Inter 2nd Year Notes

We hope that these Telangana TS Intermediate Inter 2nd Year Textbook Solutions Study Material PDF Free Download in English Medium and Telugu Medium help the student to come out successful with flying colors in the examination. This TS Inter 2nd Year Study Material will help students to gain the right knowledge to tackle any type of questions that can be asked during the exams.

TS Inter 2nd Year Zoology Study Material Telangana | TS Intermediate 2nd Year Zoology Textbook Solutions Pdf

Here you will find Telangana TSBIE State Board Syllabus TS Inter 2nd Year Zoology Study Material Pdf free download, TS Intermediate 2nd Year Zoology Textbook Solutions Questions and Answers in English Medium and Telugu Medium according to the latest exam curriculum. The chapter-wise TS Inter 2nd Year Study Material will help the students in understanding the concept behind each question in a detailed way.

Students can check the TS Inter 2nd Year Zoology Syllabus & TS Inter 2nd Year Zoology Important Questions for strong academic preparation. Students can use TS Inter 2nd Year Zoology Notes as a quick revision before the exam.

TS Intermediate 2nd Year Zoology Study Material Pdf Download | TS Inter 2nd Year Zoology Textbook Solutions Telangana

TS Inter 2nd Year Zoology Weightage Blue Print 2022-2023

TS Inter 2nd Year Zoology Weightage Blue Print

TS Inter 2nd Year Zoology Syllabus

Telangana TS Intermediate 2nd Year Zoology Syllabus

TELANGANA STATE BOARD OF INTERMEDIATE EDUCATION, HYDERABAD
ZOOLOGY-II
Syllabus (w.e.f. 2013-14)

Unit I Human Anatomy and Physiology – I (22 Periods)

Unit IA: Digestion and Absorption
Alimentary canal and digestive glands; Role of digestive enzymes and gastrointestinal hormones; Peri¬stalsis, digestion, absorption, and assimilation of proteins, carbohydrates, and fats, egestion. The calorific value of proteins, carbohydrates, and fats (for box item – not to be evaluated); Nutritional disorders: Protein Energy Malnutrition (PEM), indigestion, constipation, vomiting, jaundice, diarrhea, Kwashiorkor.

Unit IB: Breathing and Respiration
Respiratory organs in animals; Respiratory system in humans; Mechanism of breathing and its regulation in humans – Exchange of gases, transport of gases and regulation of respiration; Respiratory volumes; Respiratory disorders: Asthma, Emphysema, Occupational respiratory disorders – Asbestosis, Silicosis, Siderosis, Black Lung Disease in coal miners.

Unit II Human Anatomy and Physiology – II (22 Periods)

Unit IIA: Body Fluids and Circulation
Covered in I year composition of lymph and functions; Clotting of blood; Human circulatory system- the structure of the human heart and blood vessels; Cardiac cycle, cardiac output, double circulation; regulation of cardiac activity; Disorders of circulatory system: Hypertension, coronary artery disease, angina pectoris, heart failure.

Unit IIB: Excretory Products and their Elimination
Modes of excretion – Ammonotelism, Ureotelism, Uricotelism; Human excretory system – the structure of kidney and nephron; Urine formation, osmoregulation; Regulation of kidney function – Renin – Angiotensin – Aldosterone system, Atrial Natriuretic Factor, ADH and diabetes insipidus; Role of other organs in excretion; Disorders: Uraemia, renal failure, renal calculi, nephritis, dialysis using artificial kidney.

Unit III Human Anatomy and Physiology – III (20 Periods)

Unit IIIA: Muscular and Skeletal System
Skeletal muscle – ultrastructure; Contractile proteins & muscle contraction; Skeletal system and its functions; Joints, (to be dealt with relevance to practical syllabus); Disorders of the muscular and skeletal system: myasthenia gravis, tetany, muscular dystrophy, arthritis, osteoporosis, gout, Gregor Mortis.

Unit IIIB: Neural Control and Co-ordination
The nervous system in human beings – Centralnfervous system. Peripheral nervous system and Visceral nervous system; Generation and conduction of nerve impulse; Reflex action: Sensory perception; Sense organs; Brief description of other receptors; Elementary structure and functioning of eye and ear.

Unit IV Human Anatomy and Physiology – IV (15 Periods)

Unit IVA: Endocrine System and Chemical Co-ordination
Endocrine glands and hormones; Human endocrine system – Hypothalamus, Pituitary, Pineal, Thyroid, Parathyroid, Adrenal, Pancreas; Gonads; Mechanism of hormone action (Elementary idea only); Role of hormones as messengers and regulators) Hypo and Hyperactivity and related disorders: Common disorders – Dwarfism, acromegaly, cretinism, goiter, exophthalmic goiter, diabetes, Addison’s disease, Cushing’s syndrome. (Diseases & disorders to be dealt in brief).

Unit IVB: Immune System
Basic concepts of Immunology – Types of Immunity – Innate Immunity, Acquired Immunity, Active and Passive Immunity, Cell-mediated Immunity and Humoral Immunity, Interferon, HIV, and AIDS.

Unit V Human Reproduction (22 Periods)

Unit VA: Human Reproductive System
Male and female reproductive systems; Microscopic anatomy of testis & ovary; Gametogenesis is Sper-matogenesis & Oogenesis; Menstrual cycle; Fertilization, Embryo development up to blastocyst formation. Implantation; Pregnancy, placenta formation. Parturition, Lactation (elementary idea).

Unit VB: Reproductive Health
Need for reproductive health and prevention of sexually transmitted diseases (STD); Birth control – need and methods, contraception and medical termination of pregnancy (MTP); Amniocentesis; infertility and assisted reproductive technologies – IVF-ET, ZIFT, GIFT (Elementary idea for general awareness).

Unit VI Genetics (20 Periods)
Heredity and variation: Mendel’s laws of inheritance with reference to Drosophila. (Drosophila melanogaster Grey, Black body colour; Long, Vestigial wings), Pleiotropy; Multiple alleles: Inheritance of blood groups and Rh-factor; Co-dominance (Blood groups as an example); Elementary idea of polygenic inher¬itance: Skin colour in humans (refer Sinnott, Dtinn and Dobzhansky); Sex determination – in humans, birds, Fumea moth, genic balance theory of sex determination in Drosophila melanogaster and honey bees; Sex-linked inheritance – Haemophilia, Colour blindness; Mendelian disorders in humans: Thalassemia, Haemophilia, Sickle celled anemia, cystic fibrosis PKU, Alkaptonuria; Chromosomal disorders – Down’s syndrome. Turner’s syndrome and Klinefelter syndrome; Genome, Human Genome Project and DNA Finger Printing.

Unit VII Organic Evolution (15 Periods)
Origin of Life, Biological evolution and Evidence for biological evolution (palaeontological, comparative anatomical, embryological and molecular evidence); Theories of evolution: Lamarckism (in brief), Darwin’s theory of Evolution – Natural Selection with example (Kettlewell’s experiments on Biston Bulgaria). Mutation Theory of Hugo De Vries; Modern synthetic theory of Evolution – Hardy- Weinberg law; Types of Natural Selection; Geneflow and genetic drift; Variations (mutations and genetic recombination); Adaptive radiation – viz., Darwin’s finches and adaptive radiation in marsupials; Human evolution; Speciation – Allopatric, sym- Patric; Reproductive isolation.

Unit VIII Applied Biology (15 Periods)
Apiculture; Animal Husbandry; Pisciculture, Poultry management, Dairy management; Animal breeding; Bio-medical Technology: Diagnostic Imaging (X-Ray, CT scan, MRI), ECG, EEG; Application of Biotechnology in health: Human insulin and vaccine production; Gene Therapy; Transgenic Animals; ELISA; Vaccines, MABs, Cancer biology, stem cells.

We hope this TS Intermediate 2nd Year Zoology Study Material Pdf Download in English Medium and Telugu Medium will be useful for students to attain the right approach for precisely answering the textbook questions. If there is any trouble in grasping the concepts related to TS Inter 2nd Year Zoology Textbook Solutions Telangana, drop your questions in the comment and we will get back to you with a solution in time.

TS Inter 2nd Year Botany Study Material Telangana | TS Intermediate 2nd Year Botany Textbook Solutions Pdf

Here you will find Telangana TSBIE State Board Syllabus TS Inter 2nd Year Botany Study Material Pdf free download, TS Intermediate 2nd Year Botany Textbook Solutions Questions and Answers in English Medium and Telugu Medium according to the latest exam curriculum. The chapter-wise TS Inter 2nd Year Study Material will help the students in understanding the concept behind each question in a detailed way.

Students can check the TS Inter 2nd Year Botany Syllabus & TS Inter 2nd Year Botany Important Questions for strong academic preparation. Students can use TS Inter 2nd Year Botany Notes as a quick revision before the exam.

TS Intermediate 2nd Year Botany Study Material Pdf Download | TS Inter 2nd Year Botany Textbook Solutions Telangana

Unit I Plants Physiology

Unit II Microbiology

Unit III Genetics

Unit IV Molecular Biology

Unit V Biotechnology

Unit VI Microbes and Human Welfare

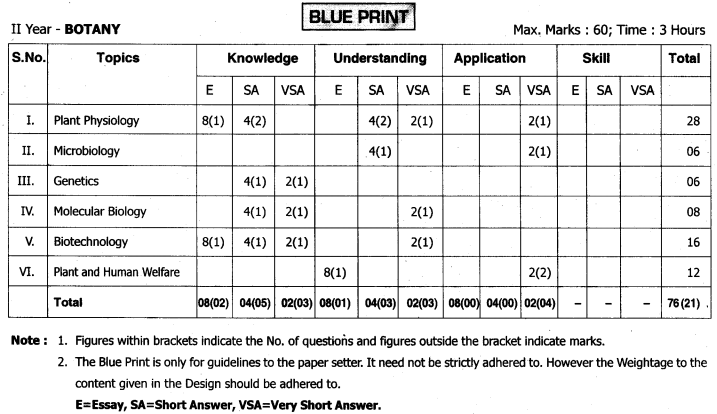
TS Inter 2nd Year Botany Weightage Blue Print 2022-2023

TS Inter 2nd Year Botany Weightage Blue Print

TS Inter 2nd Year Botany Syllabus

Telangana TS Intermediate 2nd Year Botany Syllabus

TELANGANA STATE BOARD OF INTERMEDIATE EDUCATION, HYDERABAD
BOTANY-II
Syllabus (w.e.f. 2013-14)

Unit I Plants Physiology (60 Periods)

Chapter 1 Transport in Plants
Means of Transport – Diffusion, Facilitated Diffusion, Passive symports and antiports, Active Transport, Comparison of Different Transport Processes, Plant-Water Relations – Water Potential, Osmosis, Plasmolysis, Imbibition, Long Distance Transport of Water – Water Movement up a Plant, Root Pressure, Transpiration pull, Transpiration – Opening and Closing of Stomata, Transpiration and Photosynthesis, Uptake and Transport of Mineral Nutrients – Uptake of Mineral Ions, Translocation of Mineral Ions, Phloem Transport: Flow from Source to Sink – The Pressure Flow or Mass Flow Hypothesis.

Chapter 2 Mineral Nutrition
Methods to Study the Mineral Requirements of Plants, Essential Mineral Elements – Criteria for Essentiality, Macronutrients, Micronutrients, Role of Macro- and Micro- nutrients, Deficiency Symptoms of Essential Elements, Toxicity of Micronutrients, Mechanism of Absorption of Elements, Translocation of Solutes, Soil as Reservoir of Essential Elements, Metabolism of Nitrogen -Nitrogen Cycle, Biological Nitrogen Fixation, Symbiotic nitrogen fixation, Nodule Formation.

Chapter 3 Enzymes
Chemical Reactions, Enzymatic Conversions, Nature of EnzymeAction, Factors Affecting Enzyme Activity, Temperature and pH, Concentration of Substrate, Classification and Nomenclature of Enzymes, Co-factors.

Chapter 4 Photosynthesis in Higher Plants
Early Experiments, Site of Photosynthesis, Pigments Involved in Photosynthesis, Light Reaction, The Electron TransportSplitting of Water, Cyclic and Non- cyclic Photo-phosphorylation, Chemiosmotic Hypothesis, Biosynthetic phase – The Primary Acceptor of CO2, The Calvin Cycle, The C4 Pathway, Photorespiration, Factors affecting Photosynthesis.

Chapter 5 Respiration of Plants
Cellular respiration, Glycolysis, Fermentation, Aerobic Respiration – Tricarboxylic Acid Cycle, Electron Transport System (ETS) and Oxidative Phosphorylation, The Respiratory Balance Sheet, Amphibolic Pathway, Respiratory Quotient.

Chapter 6 Plant Growth and Development
Growth- Plant Growth, Phases of Growth, Growth Rates, Conditions for Growth, Differentiation, Dedifferentiation and Redifferentiation, Development, Plant Growth Regulators – Physiological Effects of Plant Growth Regulators, Auxins, Gibberellins, Cytokinins, Ethylene, Abscisic acid, Seed Dormancy, Photoperiodism, Vernalisation.

Unit II Microbiology (10 Periods)

Chapter 7 Bacteria
Morphology of Bacteria, Bacterial cell structure – Nutrition, Reproduction – Sexual Reproduction, Conjugation, Transformation, Transduction, The importance of Bacteria to Humans.

Chapter 8 Viruses
Discovery, Classification of Viruses, structure of Viruses, Multiplication of Bacteriophages – The Lysogenic Cycle, Viral diseases in Plants, Viral diseases in Humans.

Unit III Genetics (10 Periods)

Chapter 9 Principles of Inheritance and Variation
Mendel’s Experiments, Inheritance of one gene (Monohybrid Cross) – Back cross and Test cross, Law of Dominance, Law of Segregation or Law of purity of gametes, Deviations from Mendelian concept of dominance – Incomplete Dominance, Co-dominance, Explanation of the concept of dominance, Inheritance of two genesLaw of Independent Assortment, Chromosomal Theory of Inheritance, Linkage and Recombination, Mutations – Significance of mutations.

Unit IV Molecular Biology (15 Periods)

Chapter 10 Molecular Basis of inheritance
The DNA – Structure of Polynucleotide Chain, Packaging of DNA Helix, The Search for Genetic Material, Transforming Principle, Biochemical Characterisation of Transforming Principle, The Genetic Material is DNA, Properties of Genetic Material (DNA versus RNA), RNA World, Replication – The Experimental Proof, The Machinery and the Enzymes, Transcription – Transcription Unit, Transcription Unit and the Gene, Types of RNA and the process of Transcription, GeneticCodeMutations and Genetic Code, tRNA– the Adapter Molecule, Translation, Regulation of Gene Expression – The Lac operon.

Unit V Biotechnology (22 Periods)

Chapter 11 Principles and Processes of Biotechnology
Principles of Biotechnology – Construction of the first artificial recombinant DNA molecule, Tools of Recombinant DNA Technology – Restriction Enzymes, Cloning Vectors, Competent Host (For Transformation with Recombinant DNA), Processes of Recombinant DNA Technology – Isolation of the Genetic Material (DNA), Cutting of DNA at Specific Locations, Separation and isolation of DNA fragments, Insertion of isolated gene into a suitable vector, Amplification of Gene of Interest using PCR, Insertion of Recombinant DNA into the Host, Cell/Organism, Selection of Transformed host cells, Obtaining the Foreign Gene Product, Downstream Processing.

Chapter 12 Biotechnology and it’s Applications
Biotechnological Applications In Agriculture – Bt Cotton, Pest Resistant Plants, Other applications of Biotechnology Insulin, Gene therapy, Molecular Diagnosis, ELISA, DNA fingerprinting, Transgenic plants, Bio-safety and Ethical issues – Biopiracy.

Unit VI Plants, Microbes and Human Welfare (18 Periods)

Chapter 13 Strategies for Enhancement in Food Production
Plant Breeding – What is Plant Breeding?, Wheat and Rice, Sugarcane, Millets, Plant Breeding for Disease Resistance, Methods of breeding for disease resistance, Mutation, Plant Breeding for Developing Resistance to Insect Pests, Plant Breeding for Improved Food Quality, Single Cell Protein (SCP), Tissue Culture.

Chapter 14 Microbes in Human Welfare
Microbes in Household Products, Microbes in Industrial Products – Fermented Beverages, Antibiotics, Chemicals, Enzymes and other Bioactive Molecules, Microbes in Sewage Treatment, Primary treatment, Secondary treatment or Biological treatment, Microbes in Production of Biogas, Microbes as Biocontrol Agents, Biological control of pests and diseases, Microbes as Biofertilisers, Challenges posed by Microbes.

We hope this TS Intermediate 2nd Year Botany Study Material Pdf Download in English Medium and Telugu Medium will be useful for students to attain the right approach for precisely answering the textbook questions. If there is any trouble in grasping the concepts related to TS Inter 2nd Year Botany Textbook Solutions Telangana, drop your questions in the comment and we will get back to you with a solution in time.

TS Inter 2nd Year Economics Study Material Chapter 2 Demography and Human Resource Development

Telangana TSBIE TS Inter 2nd Year Economics Study Material 2nd Lesson Demography and Human Resource Development Textbook Questions and Answers.

TS Inter 2nd Year Economics Study Material 2nd Lesson Demography and Human Resource Development

Essay Questions

Question 1.
Explain the theory of demographic transition.
Answer:
Theory of Demographic Transition :
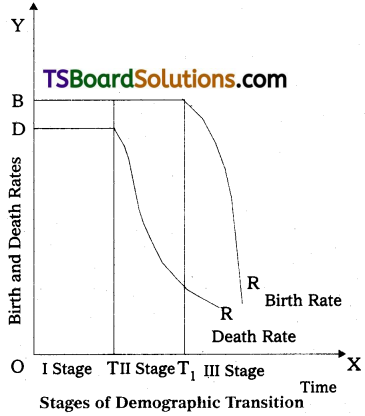
The theory of demographic transition was propunded by W.S. Thomson and F.W Notestein. They explain the theory in three stages. This theory explains the effects of changes in birth rate and death rate on the growth rate of population.

According to the ‘theory of demographic transition’, every country passes through three stages in which birth and death rates are typically associated with economic development. First Stage: Jn the first stage, the country is backward and both birth and death rates are high. High birth rate is matched by ap equally high death rate, and thus, the population remains more or less stable. Death rate are high in the first stage of agrarian economy on account of poor dites, primitive sanitation, absence of effective medicl aid, low level of standard of living, poor housing conditions, absence of opportunities for education and unscientific and irrational outlook.

Birth rates are also high in this stage due to lack of education, superstitions, social beliefs and customs about the size of family and early manages. In this stage, the actual growth rate of population (birth rate – death rate) is not high, because, high birth rate is balanced by high death rate. This stage prevailed in India before 1921.

Second stage :
This stage is characterised by rapid growth of population due to substantial reduction in the mortality rate and no corresponding decline in the birth rate. With the beginning of the process of development, the living standards improve, the education expands, medical and health facilities increase and the state makes special efforts to check the contagious diseases. Rise in income levels enable the people to improve diet. All these factors bring down the death rate.

But due to agrarian society with no mass education, attitude of the people towards the size of family does not change radically. So, the birth rate remains high. Thus, high birth rate and rapidly falling death rate contribute to high growth rate of population. In this stage, population increases at an alarming rate and economists call it as population explosion. India and faced this situation during the period 1951 – 1991.

Third stage :
Economic development rapidly changes the character of the economy from an agrarian to Industrialized one. Industrialisatioln compels people to change their attitudes towards the size of family and they recognise the merits of samll family. Education helps the people in right way of thinking. For working women, upbringing of children is not an easy task. People want to maintain reasonable standard of living. All these reinforce people’s desire to have smaller families. So, birtha rate declines significantly. The characteristics of the third stage ae low birth rate, low death rate, small family and low growth rate of population.
TS Inter 2nd Year Economics Study Material Chapter 2 Demography and Human Resource Development 1

In the above figure the time for different staages is taken on the horizontal axis and annual birth and death rates per 1,000 population on the vertical axis. In the first stage, 0 to T, birth and death rates are high and growth rate of population is very much low. But, in the second stage, T to Tj, though the death rate is falling, birth rate is remaining high and this leads to higher growth rate of population and its result is population explosion. However, in the third stage, after Tp both birth and death rates are falling and again growth rate of population will be low and population increases at a slow pace.

TS Inter 2nd Year Economics Study Material Chapter 2 Demography and Human Resource Development

Question 2.
Examine the trends of population growth in India. ,
Answer:
India possesses 2.4% of the total land area of the world, and with its population of 1.3 billions in 2017 it has a share of 17.6% in the world population. India is the second largest country in terms of population size after China. India accounts for only 7.3% of world GDP in 2017. These facts indicate that the pressure of population on the land in India is very high.

According to 1901 Census, India’s population was 236 million and according to 2011 Census, the popoulation was 1210 million and it was 1.3 billions in 2017. In a period of 116 years, the population of the country has increased by 1064 million.and growth trends of India’s populatin during 1891 – 2011.

a) During the first phase of 30 years (1891 to 1921), India’s population grew from 236 million in 1891 to 251 mollion in 1921 i.e., just by 15 million. The compound annual growth rate was 0.19% per annum for the period. Birth and death rates were more or less equal during this period.

b) During the second phase from 1921 to 1951, India’s population grew from 251 million in 1921 to 361 million in 1951 i.e., by 110 million. The compound annual growth rate of population was 1.22% which was considered as moderate. The main reason for this was a decline in death rate from 49 per thousand population to 27 per thousand population and a very small decrease in birth rate from 49 per thousand population to 27 per thousand population and a very small decrease in birth rate from 49 per thousand population to 40 per thousand population. India had entered into the second phase of demographic transition during this period with a steady but low growth rate of population. The year 1921 is regarded as great dividing year of population because of decrease in population and a turning point for the increase in the growth rate of population.

c) During the third phase from 1951 to 1981, the population of India grew from 361 million in 1951 to 683 million in 1981. There was a record growth of population by 322 million in this.30 years. The compound annual growth rate of 2.14% is nearly double the growth rate of the previous phase. Due to the planning, many measures of death control were undertaken. This resulted in a further and sharp decline of death rate to a level of 15, but the birth rate fell very slowly from 40 to 37 during this period. So, there was a population explosion during this pahse.

d) During 1981 to 2011, India’s total populatio increaed from 683 million to 1210 million indicating an increase of 77% during the 30 year period. The annual average rate of growth of population during this period was 1.84%.

1. Birth Death and Infant Mortality Rates :
The growth of populatin was .checked by the high birth and high death rates in India before 1921. Birth rate during 1901-1921 fluctuated vetween 46 and 49 per thousand papulation and the death rate between 44 and 49. So, the growth of population was little or negligible. After 1921, a clear fall in death rate is noticeable. Death rate which was at 48.6 per thousand in 1911- 20 came down to 7.1 per thousand in 2010-11.

But, the birth rate showed a slight decline initially and due to family planning drive birth rate also declined to 21.8 per thosand in 2010 – 11. There is a steady fall in the infant mortality. In the second decade of the 20th century, infant mortality rate was 218 per 1,000 live births and it is 47 per 1,000 live births in 2010. Over the years, maternal mortality has also declined. Itwas 210 per 1 lakh live births in 2007 – 2009.

2. The sex Ratio :
The sex ratio is defined as the number of females per 1.000 males. The sex ratio declined from 972 in 1901 to 946 in 1951 and to 927 in 1991. It is a disturbing feature. Subsequently there is a marginal improvement in the sex ratio. It is increased to 933 in 2001 and to 940 in 2011. Kerala alone shows a higher proportion of females of 1,084 per 1,000 males in 2011. In Punjab and Haryana, females account for 893,and 877 per 1,000 males in 2011 respectively which are at the bottom. Poverty, higher female infant mortality rates, high mortality rates among women in reproductive ages and sociological factors including a bias against female births are responsible for declining sex ratio.

3. Age Composition :
The study of age composition is useful in determining the proportion of labour force in the total population. The working age of the population is considered as 15 – 60 years, the proportion of child population in the 0 – 14 years age group is 35.6% in 2001 and this is lower than the earlier figures. The working age pertains to 15 – J60 yearws is called as productive age group. Both the child population and old population are dependent of the productive age group.

Both the child population and old population are dependent on the productive age group for their maintenance and sustenance, there is a decline in the dependency load of the population and increase in the share of the productive age group. Demographic dividend is likely to manifest in the gradual increase in the working age group of 15 – 60 years. A recent report from the UN population Fund estimages that India’s working age population will reach 65% by 2030. India will also enjoy the longest demographic dividend compared to any other country till 2055.

Question 3.
What are the causes for rapid growth of population in India?
Answer:
In India, the population has increased rapidly due to a steady decline in the death rate while birth rate remained high and this led to population explosion. Examination of causes for decline in the death rate and high birth rate is necessary.

Causes of Population Explosion :
Mainly there are three causes for a rapid growth of populatioon of a country: i) a high birth rate, ii) a relatively lower death rate and iii) immigraion. Immigration does not have much impact on India’s population growth.

I. Causes of Decline in the Death Rate :
1. Elimination of Famines :
Recurrence of famines in India under the British rule was a major cause of high mortality rate. Since independence, the situation has considerably improved as the famines have not occured on a large scale and the problems due to droughts have been met.

2. Control of Epidemics :
Cholera, small pox and malaria were the major causes of epidemics before independence. Now, small pox is eradicated completely and cholera and malaria are very much under control. There has been some decline in the incidence of tuberculosis, but, still it is a major killer in India.

3. Other Factors :
Factors such as supply of drinking water, sanitation and hygiene, spread of education, expanded medical facilities, immunisation, poverty eradication programs and improvement in living standards will reduce mortality rate.

II. Causes of High Birth Rate :
The birth rate is high in India. Except in the states of Kerala, Tamil Nadu and Goa, birth rate has not declined significantly in India due to a number of economic and social factors.

A. Economic Factors : Three economic factors namely :
1. Predominance of Agriculture :
In agrarian societies, children have never been considered as an economic burden. The peaks of productive activity in agriculture require more labour. Hence, in a predominantly agricultural economy of India, bigger families exist.

2. Urbanisation :
Due to staggering industrialisation, the process of urbanisation is slow in India and it failed to generate social forces which reduce, the birth rate.

3. Poverty :
Poverty in under developed countries results in high fertility. At a lower income level of the family, the benefits of having an additional child to the family generally exceed the cost of his upbringing. The poor have no other economic asset than their own labour. Hence, they assume that mote the number of earners in the family, the moe family earnings. The lower survival rate also reinforces the preference for children. Thus, poverty is a major factor which works against the acceptability of family planning programme by the poorer sections.

B. Social Factors :
Universality of marriage, lower age at the time of marriage, religious and social superstitions, joint family system, lack of education and a very limited use of contraceptives are some of the social factors which limit the decline in fertility.

1. Universality of Marriage :
Marriage is both a religious and a social necessity. With the spread of education, attitude of people towards marriage will change and some may decide not to marry. But, in a slow moving society where education is also not spreading fast, the above situation can not be expected.

2. Lower Age at the Time of Marriage :
The relatively lower age at the time of marriage is responsible for high fertility. Mean age at marriage for females is 18.3 years and for males 22.6 years in 2001 in India. Due to this, fertility is bound to remain high.

3. Religious and Social Supersititions :
Due to religious and social superstitions, many people prefer to have children irrespective of their economic position. Children are regarded as God given and preordained.

4. Joint Family System :
The joint family system induces young couples to have children, though they are unable to support them. Because, their economic burden is borne by the earning members. However, the process of disintegration of joint family system has not only started, and it reached to its peak level.

5. Lack of Education :
According to 2011 Census, 74% of the population is literate in India. The percentage of literacy among women is much lower i.e., 65.5% as compared to 82.1% among men. Education alone can change the attitude of the people towards family, marriage and birth of a child. Illiterate people cannot be exposed to rational ideas. There is an inverse relationship between education and fertility.

6. Use of Contraceptives :
Though the government is carrying the idea of family planning and contraceptives are made available, the response is not encouraging from certain sections due to lack of education and religious dogmas. With the expansion of education, people will certainly develop a preference for a smaller family.

TS Inter 2nd Year Economics Study Material Chapter 2 Demography and Human Resource Development

Question 4.
What are the measures required to control population explosion?
Answer:
Remedies for population Explosion :
Three fold measures are required to deal with the population explosion. These are as followed. .
I. Economic Measures
1. Expansion of the Industrial Sector :
Industrial workers are aware of the difficulties in getting employment and are interested in restricting the size of their family. They realise that in order to raise their standard of living they must restrict the size of their family. Hence, rapid industrialization is required.

2. Creation of Employment :
Urbanisation and industrialisation are mutually interdependent. We have to create more job opportunities in cities and villages and this may be a powerful check on the growth of population. The housing problem and the cost of upbringing of children in urban areas usually prohibit people from having big families.

3. Equitable Distribution of Income and Removal of Poverty :
Once the poor people start getting basic amenities of life, they have no economic compulsion to have more children and their attitude towards the size of family will undergo a change. For this, equitale distribution of income and right to work with living wage are necessary.

II. Social Measures :
Population explosion is not only an economic problem but also a social problem. Many causes of population explosion are deep rooted in the social life. Social evils must be curtailed to bring down the birth rate.

1. Education :
Most educated people delay their marriage and prefer samll family. Education, by making a frontal attack on orthodoxy and superstitions, induces people to practise family planning. When boys and girls go to schools and colleges, marriages will be delayed and this reduces the reproductive span of women. The link between female literacy and fertility is clear. But the 2011 Census has shown that the female literacy rate is 65.5% as against the male leteracy rate of 82.1%.

2. Status of Women :
The position of women is inferior to that of men both socially and economically. That is why, educatilon is less among women and hence, they are quite indifferent to family planning. People will not shed wrong notions such as preference for male child, unless the status of women improves. In a backward society, women have no choice regarding her children.

3. Age of Marriage :
Fertility depends on the age of women at marriage. In India, average age at marriage is low. Under the Child Marriage Restraint Act, 1903, the minimum age of marriage was 18 years for men and 15 years for women. In 1978, this act was amended to raise the minimum age to 21 years for men and 18 years for women. But, an effecive implementation of legal enactments is impossible due to fears in rural areas about the safety of unmarried girls, illiteracy, lack of knowledge about laws and inadequate registration system.

III. Family Planning Programme
Importance of the family planning programme as a device to control population explosion is now universally recognised. Widespread use of contraceptives has contributed most to China’s success. About 85% of married women of child-bearing age use contraceptives in China a against 41% in India. The following aspects have to be discussed in this respect.

1. Public Information Programme :
For raising the level of consciousness, couples in the reproductive age are to be informed about the usefulness of family planning. The government is using all media to publicise the importance of family planning. Once they catch the idea of family planning, they themselves starty practising it.

2. Incentives and Disincentives :
The government has introduced different schemes in which incentives are given to those who accept family planning. Cash prizes have given some inducement to the people to go for sterilisation. In India family planning is voluntary. During the emergency, some excesses were committed and forcible sterilisations were done. In fact, atleast for some time, compulsory family planning is required.

3. Family Planning Centres :
Establishment of family planning centres is an integral part of family planning programme. These centers provide various clinical facilities needed for family planning. Contraceptive distribution centres are also playing very important role.

4. Research :
Research in the field of demography, communication action, reproductive biology and fertility control must be given priority. The government of India has realised this to obtain maximum results.

Question 5.
Describe the occupational distribution of populatin in India.
Answer:
Occupational and Sectoral Distribution of Population in India:
The occupational structure of a country refers to the distribution of its population according to different occupations. Occupations are divided into three types :
i) Agriculture, animal husbandry, forestry, fishery, etc. are collectively known as primary activities. They are primary as their products are essential for human existence and these are carried on with the help of nature,
ii) Manufacturing industries, both small and large scale,- are known as secondary activities,
iii) Transport, communications, banking and finance services are tertiary activities and these help the primary and secondary activities.

Economic Development and Occupational Distribution :
Transfer of population from agriculture to industry and eventually to services is considered as an index of economic development. Colin Clark argues that “a high average level of real income per head is always associated with a high proportion of the working population engaged in tertiary industries, low real income per head is always associated with a low proportion of the working population engaged in tertiary production and a high percentage in primary production”. According to Hans Singer, economic development will be achieved by transforming a 85% agricultural dependent country in to just 15% agriculturally dependent country.

Occupational Distribution of Working Population in India :
Over the period 1951 to 2010, agriculture remained the main occupation of the people, Over the period 1951 to 1971, the percentage of labour force engaged in primary sector remained unchanged at around 72%. There is a major change in the period 1991 – 2010 with the percentaghe of labour force in the primary sector falling to 51% in 2010 from 67% in 1991.

After independence, the process of industrialisation was accelerated and the absolute number of persons getting employment in the secondary sector substantially increased. Since the population growth is rapid, and the rate of industrial growth fell short of expectations, transfer of labour force from primary sector to secondary sector and to services sector did not take place. In 2010. 22% of the working population is employed in the secondary as against 11% in 1951. During the period 1991 – 2010 the proportion of labour force in the secondary sector increased significantly from 13% to 22%.

The proportion of workers employed in the tertiary sector increased over the 60 years from 1951 to 2010.27% of the working population is employed in teh tertiary sector aas against 17% im 1951.

It is clear that over the first four decades of planning (1951 – 1991), the occupational structure of Indiain population almost remained unchanged. Only in the later two decades (1991 – 2010) some important changes are visible. In India, due to rapid growth of population, traditional agriculture with low labour productivity and slow pace of industrialisation, occupational structure has not undergone significant changes.

TS Inter 2nd Year Economics Study Material Chapter 2 Demography and Human Resource Development

Question 6.
Explain the new population policy, 2000.
Answer:
National Population Policy, 2000 :
The National Population Policy, 2000 outlined immediate medium and along term objectives. The immediate objective is to meet needs of contraception health infrastructure, health personnel and to provide integraged services for basic reproductive and child health care. The medium term objective is to reduce the total fertility rates to the replacement level by 2010. The long term objectives is to stabilise the population by 2046. A.D.

  1. Reduction of infant mortality rate below 30 per 1,000 liver births.
  2. Reduction of maternal mortality rate below 100 per 1,00,000 live births.
  3. Universal immunisation.
  4. Achieve 80% deliveries in regular dispensaries, hospitals and medical institutions with trained staff.
  5. Access to information, contgain AIDS, prevention and control of communicable diseases.
  6. Incentive to adopt two child small family norm.
  7. Facilities for safe abortions to be increased.
  8. Strict enforcement of Child Marriage Restraint Act and! Pre – Natal Diagnostic Tech-niques Act.
  9. Raising the age of marriage of girls not earlier than 18, and preferably raising it to 20 years (or) more.
  10. A special regard for women who marry after 21 and opt for a terminal method of contraception after the 3 second child.
  11. Health insurance cover for those below the poverty line who undergo sterilization after having t®w children.
  12. Achieve universal access to inforamtion, counselling and services for fertility regularisation and contraception.
  13. Bring about convergence in implementation of relat3d social sector programmes to make family welfare a people centred programme.

The National Commission on population has been set up to review the implementation of the National Population Policy from time – to – time. State level commission on population also have been setup with the objective of ensuring the implementation of national population policy.

Question 7.
Examine the role of education in eonomic development.
Answer:
Role of Education in Economic Development: Education and skill training are important for human resource development.

1) Education and economic development :
Investment in education promotes economic development. According to Todaro and Smith, education helps to increase knowledge and skill and so that more productive labour force can be created. Employment and income earning opportunities will increase due to education. Educated leaders can be created. Education provides skill and encourages modern attitudes.

2) Reduction of income inequalities :
Universal education will improve the human ca-pabilities of the people and helps them in increasing their earnings.

3) Rural development :
Education provides knowledge to the rural people and they can overcome ingnorance and superstitions. If the farmers are educated they will adopt new agricultural techniques. Education provides skill to the people to set up cottage industries and this reduces disguised enemployment.

4) Family planning :
Education enlightens people of the need to improve their standards of living and so to restrict the size of their families. Education serves as the best method of family planning in the long run aned it is also proved. If more women are educated and seek employment, fertility ratges will decline as upbringing to children becomes difficult for women employees.

5) On – the Job Training :
Many firms provide on-the-job training to their workers, because improvement in human capital increases the roductivity of physical capital. On – the – job training increases the skill and efficiency of workers and so increases in productivity and production.

Spill over income gains to the present and future generation, the meeting of skilled man-power requirements, research in science, promotion of responsible behivious, political stability, transmission of cultural heritage etc., are also possible in the society due to increased education.

If people don’t get suitable education, they not only forego much mofe at present but also in the future.

Question 8.
Describe the health policies and programmes adopted in India.
Answer:
Health Policies in India :
On the basis of recommendations by the Health Survey and Development Committee (More Committee, 1946) and the Health Survey and Planning Committee (Mudaliar Committee, 1961), the government of India prepared ing the health standard.

Objectives of this programme :

  1. Provision for the control of epidemics
  2. Providing health services; and
  3. Training of employees in the health department and the development of primary health centres in rural sector.

During the 9th and 10th Five yedr plans, efforts were intensified to improve the health status of population by optimising coverage and quality of care. Eleventh Five year plan proposed a comprehensive approach that covers individual health care, public health, sanitation, clean drinking water, access to food and knowledge of hygienes and feeding practices. The plan set the following targets to be achieved by the end of plan period (2011 -12).

  1. Reducing maternal mortality rate to 100 per 1 lakh live births.
  2. Reducing infant mortality rate to 28 per 1,000 live births.
  3. Reducing total fertility rate to 2.1.
  4. Providing clean drinking water to all by 2009.
  5. Reducing malnutrition among children of age group of 0 – 3 years by 50 percent.
  6. Reducing anemia among women and girls by 50%.
  7. Raising sex ratio for age group of 0 – 6 years to 935 per 1,000 by 201 -12 and 950 by 2016-17.

In India, life expectancy at birth was 41.2 years for the dedcade 1951-61 and improved to 68.5 years as per census 2011. Infant mortality rate is 47 per 1,000 live births in 2010 as against 146 per 1,000 in 1951. During 2001 – 03 maternal mortality rate was 301 per 1 lakh live births and it was reduced to 200 by 2010. Improving birth attendance and midwifery facilities at a rapid rate are required to reduce maternal mortality rate in India. Total fertility rate (total number of live births by a woman during her entire reproductive period) in the early 1950s was 6.0 and it has come down to 2.4 in 2011.

Health Programmes in India :
The 11th Five year plan aimed for inclusive growth by introducing National Rural Health Mission and National Urban Health Mission.

i) National Rural Health Mission (NR HM) :
This intends to increase access and utilizztion of quality health by strengthening healht infrastructure. It was planned to have (i) 5 lakh Accredited Social Health Activists (ASHAs) by 2008, (ii) All sub – centres functional with 2 Auxiliary Nurse Midwives (ANMs) by 2010. (iii) All Primary Health Centres (PHCs) to be provided 3 staff nurses for 24 hours on all days by 2010. (iv) 6,500 Community Health Centres to be establisghed, strengthened with 7 specialists and 9 staff nurses by 20121 (v) 1,800 Taluka Hospitals and 600 District Hospitals to be strengthened by 2012. (vi) Mobile Medical Units for each district by 2009.

ii) Janani Suraksha Yojana (JSY) :
This scheme has the dual objectives of reducing maternal and infant mortality by promoting institutional deliveries. It is 100% centrally sponsored, and integrates cash assistance with medical care. A gradual approach of increasing istitutional capacity and encouraging institutional deliveries will ensure success of the scheme. Under NRHM, out of 184.25 lakh institutional deliveries in the country (as on 1st April, 2007), JSY beneficiaries Were 28.74 lakhs.

iii) National Urban Health Mission (NUHM) :
This programme covers all cities with a population of 1 lakh and above.

In relation to health, the 2018-19 Union Budget announced a flagship National Health Protection Scheme to cover over 10 crore poor and vulnerable families, approximately 50 crore beneficiaries, providing coverae upto Rs. 5 lakh per family per year for secondary and tertiary care hospitalization. This will be the World’s largest government funded health care programme. The revised estimate for the National Health Insurance Programme Rashtriya Swasthya Bima Yojna (RSBY) for Financial year 2018 -19 was Rs. 2,700 crore, and the allocation in the Union Budget for Financial year 2019 – 20 is Rs. 6,556 crore.

iv) Clean Drinking Water and Sanitation :
Unsafe drinking water increases the risk of diseases and malnutrition and water – borne diseases which effect health adversely. That is why, clean drinking water is a vital necessity. Lack of sanitation is directly responsible for several water borhne diseases.

According to World Development Indicators (2008), access to improved water source was available to 86% of the population in 2004. According to World Bank, 33% of the population in India had access to improved sanitation facilities in 2004.

A big initiative of the NDA government has been the Swachh Bharat Mission (SBM) launched on October 2, 2014 with the goal of making India Open Defecation Free (ODF) by October 2019. The main aim of SBM has been the construction of toilets. Official statistics by the Ministry of Drinking Water and Sanitation claim that as of January 2019, 92.2 million toilets had been built since the inception of SBM, leading to a 98 percent rural sanitation coverage with 604 districts and 5,52,000 villages declared ODF.

TS Inter 2nd Year Economics Study Material Chapter 2 Demography and Human Resource Development

Question 9.
What are the different indices to measure human development? Explain them.
Answer:
The United Nations Development Programme (UNDP) introdeuced the HDI in its first Human Development Report, 1990, under the guidance of Mahbub – UI – Haq, an economist from Pakistan.

UNDP Human Development Report, 1997 descruves human development as “the process of widening people’s choices and the level of well – being they achieve. Regardless of the level of development, the three essential choices are to lead a long and healthy life, to acquire knowledge and to have access to the resources needed for a decent standard of living.

According to Mahbub – U1 – Haq, “the difference between the economic growth and the human development schools is that the first exclusively focuses on the expansion of only one choice income – while the second embraces the enlargement of all human choicex – whether economic, social, cultural of political”.

HDI measures the average achievement in three basic dimensions of human development and these are : (i) a long and healthy life as measured by life expectancy at birth, (ii) knowledge as measured by the adult literacy rate and the gross enrolment ratio and (iii) a decent standard of living as measured by GDP per capita (PPP US$).

Before calculating HDI, an index for each of the three dimensions is creatd. For this, maximum and minimum values are chosen for each indicator as given below.
TS Inter 2nd Year Economics Study Material Chapter 2 Demography and Human Resource Development 2

Performance in each dimension is expressed as a value between 0 and 1 by applying the formula given below :
TS Inter 2nd Year Economics Study Material Chapter 2 Demography and Human Resource Development 3

The HDI is calculated as a simple average of the dimension indices.

According to HDR 2011, countries are grouped under four categories :
(1) countries in the HDI range 0.8 and above are in the very high human development group, (2) countries in HDI range 0.7 to 0.8 are in the high human development group, (3) countries in the HDI range 0. 5 to 0.7 are in the range of medium human development group, and (4) countries in the HDI range less than 0.5 are in the low human development group.

India which was ranked at the 134th position in HDI in 1975 had improved its rank to 128 in 2005, but in 2011 its position slipped again to 134th rank. Norway ranked first and Australia ranked second in 2011.

India was at 135th position in HDI out of 187 countries in 2013. As per annual HDI – 2019. report, India ranked at the 129th position in 2018 out of 189 countries.

Human Development Report, 1995 introduced two global gender indices. These are : (1) Gender related Development Index (GDI) and (2) Gender Empowerment Measure (GEM).

The GDI attempted to capture achievements through the same set of basic capabilities as included in the HDI – life expectancy, educational attainment and income. HDI will be adjusted for gender inequality.

The Gender Empowerment Measure (GEM) indicates whether women are able to participate actively in economic and political life. It focuses on political participation (women’s share in parliament seats), economic participation (share in higher level and professional positions) and power over economic resources (income gaps).

2) Human Poverty Index (HPI) :
Human Development Report, 1997 introduced the concept of Human Poverty Index. This index concentrates on deprivation in three essential elements of human life already reflected in HDI – longevity, knowledge and a decent living standard. HDR, 2009 used the following variables for calculating HPI : (i) percentage of people expected to die before age of 40 years, (ii) percentage of adult illiterates, (iii) percentage of people with access to health services and to safe drinking water and (iv) percentage of malnourished children under five years.

3) Gross National Happiness Index :
Countries like Bhutan are measuring their development with gross national happiness index. There is a need to bring a change in the existing method of measuring the development.

Gross National Happiness has been devised by Bhutan as an alternative indicator for GDP to measure progress or development. The term Gross National Happiness (GNH) was coined by the Fourth king of Bhuta, Jigme Singye Wangchuck in the 1970’s, The concept implies that sustainable development should take a hollistic approach towards notions of progress and give equal importance to non – economic aspects of wellbeing. The GNH index is constructed based upon a multidimensional methodology known as the Alkire – Foster method.

The concept of GNH is explained by four pillars :
good governance, sustainable socio-economic development, cultural preservation and environmental conservation. These four pillars are further classified into nine domains : Psychological wellbeing, health, educatin, time use, cultural diversity and resilience, good governance, community vitality, ecological diversity and resilience, and living standards. All domains are weighted equally.

Question 10.
Explain the views of Amartya Sen on Human Development.
Answer:
Views of Amartya Sen on Human Development :
Amartya Sen is the first Indian who won the Nobel Prize of Economics. Amartya Sen’s book “Development as Freedom” was published in 1999. He argues that the development is the process of expanding human freedoms that people enjoy.

Sen says that freedom is both the primary end and the principal mean of development. For this, he gives two reasons :
(i) the only acceptable evaluation of human progress is enhancement of freedom and (2) the achievement of development is dependent on the free agency of people. Growth of GNP or of Individual incomes can be very important as means to expanding the freedom enjouyed by the people, Freedom depends on other determinants also, such as social and economic arrangements (facilities for education and health care) and political and civil ritghts (the liberty to participate in public discussion and scrutiny). Industrialization or technololgical progress or social modernization can substantially contribute to expanding human freedom, but freedom depends or other influences also.

Freedom creates growth. Freedom is a principal determinant of individual initiative and social effectiveness. It enhances the ability of individuals to help themselves. Raising human capability improves the choices, well – being and freedom of people and also their role in influencing social change and economic production, /economic security derives from freedom. The institutional arrangements are also influenced by the freedoms, though the liberty to participate in social choice and in the making of public decisions.

He mentions five freedoms :
political freedom, economic facilities, social opportunities, transparency guarantees and protective security. Political freedoms (free speech and elections) help to promote economic security. Political freedom and civil rights have to be achieved as a direct good in their own right, but not thorugh the achieving GDP growth. Economic facilities (opportunities for participation in trade and production) will help to generate personal abundance and public resources for social facilities. Social opportunities (education and health) facilitate economic participation. Freedom of different kinds can strengthen one another.

Sen advocates government measures to support these freedoms by providing public education, health care, social safety nets, good macro economic policies, productivity and environment protection.

Development requires the removal of sources of unfreedoms : poverty, tyranny, poor eco-nomic opportunities, soeial deprivation, neglect of public facilities and repression by States.

According to Sen, the basic concern of human development is our capability to lead the kind of lives we have reason to value rather than the usual emphasis on increasing GDP per capita incomes.

Short Answer Questions

Question 1.
Explain the trends of Birth and death rates in India.
Answer:
The growth of population was checked by the high birth and high death rates in India before 1921. Birth rate during 1901 – 1921 fluctuated between 46 and 49 per thousand and the death rate between 44 and 49. So, ;the growth of population was little or negligible. After 1921. a clear fall ini death rae is noticeable. Death rate which was at 48.6 per thousand in 1911 – 20 came down to 7.2 per thousand in 2010 -11. But, the birth rate showed a slight decline initially and due to family planning drive birth rae also declined to 22.1 per thousand in 2010 = 11.

For the last sixty years, there is a steady fall in the infant mortality. In the second decade of the 20th century, infant mortality rate was 218 per 1,000 live births and it is 47 per 1,000 live births in 2010, Over the years, maternal mortality has also declined. It is 210 per 1 lakh births in 2007 – 2009.

Thus, the high growth rate of population can be explained in terms of high birth rate but a relatively fast declining death rate. Kerala, Tamil Nadu, Andhra Pradesh, West Bengal, Karnataka, Maharashtra and Punjab have achieved a birth rate below 20 per 1,000. These state are in the 3rd staghe of demographic transition. But, Haryana and Gujarat which occupied a high place in India in terms of per capita income far behind in reduction of birth rate. Uttar Pradesh, Rajasthan, Bihar and Madhya Pracjesh have a very high birht rate in the range of 25 – 31 per thousand.

These states are in the 2nd stage of demographic transition. It is not easy to bring down the birth rate, when the socio-economic conditions favour a larger family. Still, family planning has not become a way of life for many people. People’s attitudes towards marriage, family, family planning must change to achieve a substantial decline in the birth rate.

TS Inter 2nd Year Economics Study Material Chapter 2 Demography and Human Resource Development

Question 2.
Explain the sex ratio in India.
Answer:
The sex ratio is defined as the number of females per 1,000 maks. Explains the sex ratio in IUndia. The sex ratio declined from 972 in 1901. to 946 in 1951 and to 927 in 1991, It is a disturbing featue. Subsequently there is a marginal improvement in the sex ratio. It is increased to 933 in 2001 and to 940 in 2011. Kerala alone shows a higher proportion of females of 1,084 per 1,000 males in 2011. in Punjab and Haryana, females account for 893 and 877 per 1,000 males in 2011 respectively which are at the bottom. Poverty, highte female infant mortality rates, hnigh mortality rates among women in reproductive ages and sociological factors are responsible for declining sex ratio.

Question 3.
Describe the family planning programme in India.
Answer:
Family Planning Programme

Importance of the family planning programme as a device to control population explosion is now universally recognised. Widespread use of contraceptives has contributed most to China’s success. About 85% of married women of child-bearing age use contraceptives in China a against 41% in India. The following aspects have to be discussed in this respect.

1. Public Information Programme :
For raising the level of consciousness, couples in the reproductive age are to be informed about the usefulness of family planning. The government is using all media to publicise the importance of family planning. Once they catch the idea of family planning, they themselves starty practising it.

2. Incentives and Disincentives :
The government has introduced different schemes in which incentives are given to those who accept family planning. Cash prizes have given some inducement to the people to go for sterilisation. In India family planning is voluntary. During the emergency, some excesses were committed and forcible sterilisations were done. In fact, atleast for some time, compulsory family planning is required.

3. Family Planning Centres :
Establishment of family planning centres is an integral part of family planning programme. These centers provide various clinical facilities needed for family planning. Contraceptive distribution centres are also playing very important role.

4. Research :
Research in the field of demography, communication action, reproductive biology and fertility control must be given priority. The government of India has realised this to obtain maximum results.

Question 4.
What is the relation between economic development and occupational distribution .
Answer:
Transfer of population from agriculture to industry and eventually to services is considered as an index of economic development. Colin Clark argues that “a high average level of real income per head is always associated with a high proportion of the working population engaged in tertiary industries, low real income per head is always associated with a low proportion of the working population engaged tertiary production and a high percentage in primary production”.

A.G.B. Fisher also said the same :
‘We may say that in every progressive economy there has been a steady shift of employment and investment from the essential primary activities to secondary activities of all kinds and to a still geater extent into tertiary production”. Simon Kuznets also observed the sae and says that when the development of a country takes place, the percentage of population engaged in primary sector shifts to industry and later to service sector. According to Hans Singer, economic development will be achieved by transforming a 85% agricultural dependent country in to just 15% agriculturally dependent country.

Occupational Distribution of Working Population in India :
Data provided in reveals that, over the period 1951 to 2010. agriculture remained the main occupation of the people. Over the period 1951 to 1971, the percentage of labour force engaged in primary sector remained unchanged at around 72%. There is a major change in the period 1991 – 2010 with the percentaghe of labour force in the primary sector falling to 51% in 2010 from 67% in 1991.

Question 5.
Explain the concept of Human resource development and its importance.
Answer:
Theodore W. Schutlz has argued that investment in education enhances human capital formation. It production is carried out without it and only with the help of unskilled and unedu- • cated labour, the production will fall catastrophically from its existing level.

Any activity which augments man’s productive capacity contributes to the human resource develoopment. Schultz listed the following five such activities :

  1. Health facilities and services, all expenditures which affect the life expectancy, strength and stamina, and the vigour and vitality of the people;
  2. On-job training including old style apprenticeships organised by firms;
  3. Formaly organised education at the elementary, secondary and higher levels;
  4. Study programmes for adults which are not organised by firms including extension programmes notably in agriculture; and
  5. Migration of individuals and families to adjust to changing job opportunities.

Amartya Sen also emphasizes the importance to be given to human resource development, where in he utilises entitlement and capability approach. Entitlements of individuals, especially women, can increase through education as it is considered as an asset and capability refers to one’s own wellbeings as healthy people can contribute a lot for the development of an economy. Here also health care systems where women’s health should be properly taken care, as they usually suffer from certain disabilities from childhood due to lack of proper nutrition and more usually suffer from certain disabilities from chilhood due to lack of proper nutrition and more attention should be bestowed on improving their capabilities for their active work participation.

Importance of Human Resource Development :
Education is moe important as it contributes most to the development of human resources.

Human resources development plays an important role in economic development. Effective use of physical capital itself is dependent upon human resources. Technical, professional and administrative people are required to make effective use of material resources. That is why, more investment in human resources is required, Countries are not developed due to underdevelopment of human resources. The general masses in these countries are either illiterate or with very low level of education, many are unskilled and untrained, and their general health is very poor. The development of human resources and the process of economic development both proceed together and reinforce one another.

Question 6.
Explain the National Health Policy, 2017.
Answer:
The National Health Policy, 2017 envisages providing larger package of assured compre-hensive primary health care through the health and wellness centres. The policy aims to attain the highest possible level of health and well – being for all through a preventive and promotive health care and universal access to quality health services without anyone having to face financial hardship, This would be achieved through increasing acess, improving quality and lowering the cost of health care delivery.

The highlights of the policy are (i) assurance based approach, (ii) micronutrient deficiency, (iii) Make-in-India initiative, and (iv) application of digital health. One of the mandates of the NHP, 2017 is the use of information technology towards health, care.

Key Targets of the National Health Policy, 2017, are as follows :

  1. Increase health expenditure of government from the existing 1.15 per cent to 2.5 per cent of the GDP by 2025.
  2. Increase life expectancy at birth from 67.5 years to 70 years by 2025.
  3. Reduction of total fertility rate (TFR) to 2.1 national and sub – national level by 2025.
  4. Reduce infant mortality rate (IMR) to 28 by 2019. In 2016 the IMR was 34 per 1000 live births.
  5. To redice the prevalence of blindness to 0.25% 1000 by 2025 and disease burden by one third from current levels.
  6. Incease utilization of public health facilities by 50% from current levels by 2025.
  7. More than 90% of the newborn are fully immunized by one year of age by 2025.
  8. Ensure skilled attendance at birth above 90% by 2025.
  9. Relative reduction in prevalence of current tobacco use by 15% 2020 and 30% by 2025.
  10. Access to safe water and sanitation to all by 2020 (Swachh Bharat Mission).
  11. Increase the share of stat on health to more than 80% of their budget by 2020.

TS Inter 2nd Year Economics Study Material Chapter 2 Demography and Human Resource Development

Question 7.
Explain the method to construct Human Development Index.
Answer:
UNDP Human Development Report, 1997 describes human development as “the process of widening people’s choices and the leel of well-being they achieve. Regardless of the level of development, the three essential choices are to lead a long and healthy life, to acquire knowledge and to have access to the resources needed for a decent standard of living. Ohter choices highly valued by many people, range from political, economic and social freedom to opportunities for being creativbe and productive and enjoying self respect and guaranteed human rights”.

According to Mahbub-UI-Haw, “the difference between the economic growth and the human development schools is that the first exclusively focuses on the expansion of only one choice income – while the second embraces the enlargement of all human choices – whether economic, social, cultural of political”.

Construction of Human Development Indes (HDI) :
HDI measures the average achievement in three basic dimensions of human development and these are : (i) a long and healthy life as measured by life expectyancy at birth, (ii) knowledge as measured by the adult literacy rate and the gross enrolment ratio and (iii) a decent standard of living as measured by GDP per capita (PPP US$).

Before calculating HDI, an index for each of the three dimensions is created. For this, maximum and minimum values are chosen for each indicator as given below :

IndicatorMaximum ValueMinimum Value
1. Life Expectancy at Birth8525
2(i). Adult Literacy Rate1000
(ii) Gross Enrolment Ratio1000
3. GDP Per Capita (PPP US $)40,000100

Performance in each dimension is expressed as a value between 0 and 1 by applying the formula given below :
TS Inter 2nd Year Economics Study Material Chapter 2 Demography and Human Resource Development 4

The HDI is calculated as a simple average of the dimension indices.

According to HDR 2011, countries are grouped under four categories :
(1) countries in the HDI range 0.8 and above are in the very high human development group, (2) countries in HDI range 0.7 to 0.8 are in the high human development group, (3) countries in the HDI range 0.5 to 0.7 are in the range of medium human development group, and (4) countries in the HDI range less than 0.5 are in the low human development group.

India which was ranked at the 134th position in HDI in 1975 had improved its rank to 128 in 2005, but in 2011 its position slipped again to 134th rank. Norway ranked first and Australia ranked second in 2011.

India was at 135th position in HDI out of 187 countries in 2013. As per annual HDI – 2019. report, India ranked at the 129th position in 2018 out of 189 countries.

Question 8.
What do you mean by Gender Related Development Index (GRDI) and Human Poverty Index (HPI)?
Answer:
Gender Related Indices : Human Development Report, 1995 introduced two global gender indices. These are : (l) Gender related Development Index (GDI) and (2) Gender Empowerment Measure (GEM).

The GDI attempted to capture achievements throught the same set of basic capabilities as included in the HDI – life expectancy, educational attainment and income. HDI will be adjusted for gender inequality. The greater the gender inequality in basic human development, the lower GDI compared to HDI. The greater the difference between HDI and GDI, the more is the inequality. Near gender equality exists in Norway, Canada, United States, United Kingdom, Japan, Sri Lanka, China and Indonesia and gender inequality exists i Saudi Arabia, Pakistan, Iran, India and Nigeria. There is a greaer awareness in the world about gender inequality and efforts are being made to reduce gender inequality. Women movements are promoting and working for gender equality.

The Gender Empowerment Measure (GEM) indicates whether women are able to participate actively in economic and political life. It focuses on political participation (women’s share in parliament seats), economic participation (share in higher level and professional opositions) and power over economic resources (income gaps).

Human Poverty Index (HPI) :
Human Development Report, 1997 introduced the concept of Human Poverty Index. This index concentrates on deprivation in three essential elements of human life already reflected in HDI – longevity, knowledge and a decent living standard. HDR, 2009 used the following variables for calculating HPI : (i) percentage of people expected to die before age of 40 years, (ii) percentage of adult illiterates, (iii) percentage of people with access to health services and to safe drinking water and (iv) percentage of malnourished children under five years. Human Poverty Index for developingh countries reveals the existence of high value of HPI in Niger, Bangladesh, Pakistan and India.

Question 9.
Explain the concept of gross national happiness Index.
Answer:
Gross National Happiness Index : Countries like Bhutan are measuring their development with gross national happiness index. There is a need to bring a change in the existing method of measuring the development.

Gross National Happiness has been devised by Bhutan as an alternative indicatror for GDP to measure progress or development. The term Gross National Happiness (GNH) was coined by the Fourth king of Bhutan, Jighme Singye Wangchuck in the 1970’s. The concept implies that sustainable development should take a holistic approach towards notions of progress and give equal importance to non – economic aspects of wellbeing. The GNH index is constructed based upon a multidimensional methodology known as the Alkire – Foster method.

The concept of GNH is explained by four pillars :
Good governance, sustainable socio – economic development, cultural preservation and enviromental conservation. These four pillars are further classified into nine domains : Psychological wellbeing, health, education, time use, cultural diversity and resilience, good governance, community vitality, ecological diversity and resilience, and living standards. All domains are weithted equally. The domains represent 33 indicators (variables) of Wellbeing. The weights of the various variables in a domain are unequal. In general, subjective indicartors have been given lower weights than objective indi-cators.

In happiness, averages do not count and that is why, within each indicastor, a ‘sufficiency target’ is set. A person is considered ‘happy’ under this indicator when the ‘sufficiency’ level is achieved. Based on answers for the 33 indicators, judgement is given how a person is happy in the following way.
Sufficiency in 77% – 100% of the indicators : deeply happy.
Sufficiency in 66% – 76% of the indicators : extensively happy.
Sufficiency in 50% – 65% of the indicators : narrowly happy.
Sufficiency in 0% – 49% of the indicators : unhappy or not – yet – happy.

Very Short Answer Questions

Question 1.
Birth rate.
Answer:
It is the Ratio of number of births per 1,000 population in a year. Birth rate during 1901 – 1921 fluctuated between 46 to 49 per 1,000 population. Birth rate declined to 21.8 per 1,000 in the year 2010 – 11.

Question 2.
Death rate.
Answer:
It is the Ratio of deaths per 1,000 population in a year. The death rate during 1901 -1921 fluctuated between 44 and 49 per 1,000 population. It was 48.6 per 1,000 population in 1911 – 20. It was reduced to 7.1 per 1,000 in 2010 – 11.

TS Inter 2nd Year Economics Study Material Chapter 2 Demography and Human Resource Development

Question 3.
Infant mortality rate.
Answer:
It is the ratio of number of deaths per 1,000 bom children in a year. In the second decade of the 20th century, this rate was 218 per 1,000 live birth and it is 47 per 1,000 live births in 2010.

Question 4.
Maternal Mortality Rate.
Answer:
‘It is the ratio of numer of delivery deaths for, lakh women in a year, over the years maternal mortality rate has also declined. It was 210 per 1 lakh live births in 2007 – 09.

Question 5.
Sex ratio.
Answer:
It is the number of females per 1,000 males. This ratio was declined from 972 in 1901 to 946 in 1951 and 927 in 1991. It is increaed to 933 in 2001 and 940 in 201. Poverty, higher female infant mortality rates, high mortality rates among Women in reproductive ages are responsible for declining sex ratio.

Question 6.
Population explosion.
Answer:
Population increases faster than food supply and this imbalance leads to over population and this is called “population explosion”.

In the second stage’ of the theory of demographic transition, due to substantial reduction in the mortality rate and no corresponding decline in the birth rate, rapid growth of population exists. In this stage population increases at an alarming rae and economists called it “population explosion”. India had faced this problem during the period 1951 – 1991.

Question 7.
Contraceptives.
Answer:
Contraceptives are one of the family planning method to control population. The family planning centres provide contraceptive distribution centres.

Question 8.
Literacy rate.
Answer:
The reading and writing skills of a person is known as literacy. The literacy rate Can be studied with the help of following formula.
TS Inter 2nd Year Economics Study Material Chapter 2 Demography and Human Resource Development 5

The literacy rate is improved form 18 percent in 1951 to 74 percent in 2011. similarly male leteracy improved from 27 percent to 82 percent and female literacy from a percent to 66 percent in the same period.

Question 9.
National Rural Health Mission.
Answer:
This scheme was introducedd during 11th plan. It intends to increases access and utilisation of quality health by stregthening health infrastructure. It was planned to have accredited social Health activistis (ASHA’s) by 2008. All sub centres functional with 2 auxilliary nurse midwines (ANMs) by 2010. mobile medical unit for each district by 2009.

TS Inter 2nd Year Economics Study Material Chapter 2 Demography and Human Resource Development

Question 10.
Janani Suraksha Yojana.
Answer:
Janani Suraksha Yojana :
This programme was started in the year 2005. This scheme is meant for promoting health and nutrition to women and child. It has 2 objectives.

  1. Reducing Infant Mortality Rate
  2. Reducing Maternal Mortality Rate.

It is a gradual approach of increasing istitutional capacity encouraging institutional deliveries will ensure success of the scheme.

Question 11.
National Urban Health Mission.
Answer:
It is intended to meet health needs of uraban poor, particularly the slum dwellers and other marginalized dwellers who may be in slums or citites. This programme covers all cities with a population of 1 lakh and above.

Question 12.
Gender empowerment measure.
Answer:
This focuses on women’s participation in economc and political life and their power over econonmic resources. This concept also indicates whatever the women’s share in parliament seats, share in higher level and professional positions, and income gaps.

TS Inter 2nd Year Economics Study Material Chapter 2 Demography and Human Resource Development

Question 13.
HumcCn poverty Index (HPl)
Answer:
The concept was introduced by the human development report 1997. This index concentrates on deprivation in three essential elements of human life already reflected in HDI that is longivity, knowledge, and a decent living standard. HDR 2009, used the following variables for calculating HPI, percentage of people expected to die before age of 40 years, percentage of adult illeterates, percentage of people with access to health services and to safe drinking water.

TS Inter 2nd Year Economics Study Material Chapter 1 Economic Growth and Economic Development

Telangana TSBIE TS Inter 2nd Year Economics Study Material 1st Lesson Economic Growth and Economic Development Textbook Questions and Answers.

TS Inter 2nd Year Economics Study Material 1st Lesson Economic Growth and Economic Development

Essay Questions

Question 1.
Explain the concepts of economic growth and economic development. What are their differences?
Answer:
In common parlance the two terms – economic growth and economic development connote the same meaning and there appears to be no difference between them. Generally, economic growth refers to the problems of developed countries and economic development to those of under developed countries. But some economists have drawn a line of demarcation between economic growth and economic development.

Economic growth :
According to C.R Kindleberger, “Economic growth means more out-put, while economic development implies both more output and changes in the technical and institutional arrangement by which it is produced and distributed”. The word growth is primanly of quantitative significance, while the word development is of both quantitative and qualitative significance.

Economic Development :
‘Economic development’ is a wider concept than the concept of ‘economic growth’. Development includes not only economic growth but also certain other positive changes in other spheres of life. In fact, it includes development in all spheres. Economic development is closely associated with the concept of economic growth. It implies progressive changes in the socioeconomic structure of a country, where a sustained rise in livihg standards as well as an equitable growth to be achieved.

Economic growth is a necessary but not sufficient condition of economic development. Economic development is a normative concept. The definition of economic development given by Michael R Todaro is an increase in living standards, improvement in self-esteem needs and freedom from oppression as well as a greater choice.

According to United Nations Expert Committee, “Development concerns with not only man’s material needs but also the improvement of the social conditions of his life. Development is, therefore not only economic growth, but also growth plus change – social, cultural, institutional and economic.

According to Michael P. Todaro “Development must be conceived as a multidimensional process involving major changes in social structures, popular attitudes and national institutions as well as the acceleration of economic growth, the reduction of inequality and the eradication of poverty”. John Friedmann defines development as “an innovative process leading to the structural transformation of social system”.

TS Inter 2nd Year Economics Study Material Chapter 1 Economic Growth and Economic Development

Question 2.
Explain the objectives of economic development.
Answer:
The major objectives of economic development countries like India can be mentioned as here under :

1. High Rate of Growth :
All the developing economies including countries such as China and India are striving hard to achieve high rates of economic growth. For instance all the Indian Five Year plans have given primary importance to higher growth of real national income. During the first three decades of planning, the rate of economic growth was not so encouraging in our economy. Till 1980, the average annual growth arate of Gross Domestic Product was 3.75 per cent jagainst the average annual growth rate of pooplation at 2.5 percent. Hence the per capita income grew only around 1 per cent. But from the 6th plan onwards, there has been considerable change in the Indian economy.

In the Sixth, Seventh and Eighth plans the growth ratge was 5.4 per cent, 5.8 per cent and 6.8 per cent respectively. The Ninth Plan, started in 1997 targeted a growth rate of 7 per cent per annum and realized only 5.35 per cent average GDP growth. In the later years, the economy achieved even a high rate of growth of 9 per cent. Though this is considered to be a relatively high rate of growth, China achieved even 10 per cent rate of economic growth in first decade of 21st century. For the Twelfth plan (2012-17) target Us 7.9 per cent average growth. From 2014-15 to 2018-19, GDP has grown at 7.5 per cent.

2. Economic Self-Reliance:
Self reliance means to stand on one’s own. legs. In the Indian economic context, it implies that dependence on foreign aid should be as minimum as possible. At the beginning of planning, we had to import food grains from USA to meet our domestic demand. Similarly, for accelerating the process of industrialization we had to import capital goods in the form of heavy machinery and technical know – how. For improving infrastructural facilities like roads, railways, power, the country had to depend on foreign aid to raise the rate of investment.

As excessive dependence on foreign sector may lead to economic colonialism and in this regard the planners rightly mentioned the objective of self – reliance from the Third Plan onwards. In the Fourth Plan much emphasis was given to self-reliance, particularly in the production of food grains. In the Fifth Plan, our objective was to earn sufficient foreign ex-change through export promotion and import substitution. India has made remarkable progress in achieving self-reliance. In later years, most of the developing economies such as China, Brazil, South Africa, South Korea, Vietnam and some of the other African, Asian and Latin American countries are aiming to achieve self-reliance.

3. Social Justice :
Social justice means equitable distribution of the wealth and income of the country among different sections of the society. In India, we find that a large number of people are poor, while a few lead a luxurious life. Therefore, another objective of development is to ensure economic and social justice and to take care of the poor and weaker sections of the society. The five year plans in India have highlighted four aspects of social justice. They are :

i) Adherence to democratic principles in the political structure of the country.
ii) Establishment of social and economic equity and removal of regional disparities;
iii) Putting an end to the process of centralization of economic power and simultaneously attaining decentralization of power; and
iv) Efforts to raise the conditions of backward and depressejd classes.

4. Modernization :
Modernization aims at improving the standard of living of thepeople by adopting a better scientific technique of production, by replacing the traditional backward methods and by bringing changes in the rural structure and institutions. These changes aim at increasing the share of industrial output in the national income, upgrading the quality of products and diversifying the Indian industries. Further, it also includes expansion of banking and non-banking financial institutions to agriculture and industry. It envisages modernization of agriculture including implementation of land reforms. Currently modernization is taking place due to phenomenal growth of information technology sector. Land reforms either of radical nature or modest nature have been implemented in most of the developing countries, especially in countries like China, Vietnam and India.

5. Economic Stability :
Economic stability is ensured wh£n a non-inflationary full employment growth occurs in a country. After the Second Plan, the price level started increasing in India for a long period of time. Therefore, the planners have tried to stabilize the economy by properly controlling the rising trend of the price level. The progress in this direction has been satisfactory. Broad objective of economic development has been a non-inflationary self- reliant growth with social justice.

6. Sustainable Development :
The Brundtland Report defined sustainable development as “meeting the needs of the present generation without compromising the needs of future generations”. Sustainable development means that development should ‘keep going’.

Sustainable development aims at accelerating economic development in order to conserve and enhance the stock of environmental, human and physical capital without making future generations worse off. The damaging effects of economic development on environmental degradation can be reduced by a judicious choice of economic and environmental policies and environmental investments. Choice between policies and investments should aim at harmonising economic development with sustainable development.

7. Inclusive Growth :
The inclusive growth as a strategy of economic development received attention owing to a rising concern that the benefits of economic growth have not been equitably shared. The inclusive growth stresses the inclusiveness of the hitherto excluded population in the growth process, which is expected to bring in several other benefits as well to the economy. The concept of inclusion should be seen as a process of including the excluded marginalized sections of the population whose share in the total income remained relatively at a low level, for instance bottom 20% of the population getting a share of 2 to 3% of the national income. Hence, by adopting inclusive growth strategy, if the bottom 20% share can increase to 5-10% at least, then it can be termed as inclusive growth.

TS Inter 2nd Year Economics Study Material Chapter 1 Economic Growth and Economic Development

Question 3.
Explain the Indicators of economic development.
Answer:
The Economic Development Indecators are ae follows .

1. Real National Income :
One of the methods to measure economic development is in terms of an increase in the economy’s real national income over a long period of time. Higher real national income is the index of higher level of economic development and vice-versa. The division of global economy into developed and developing countries is based on the real national income. This is not a satisfactory indicator due to the following reasons : (a) The price changes have to be ruled out while calculating real national income.

But variations in prices are inevitable. A short period rise in national income does not constitute economic developnjent. (b) It fails to take into consideration changes in the growth of population. If a rise in real national income is accompanied by a faster growth in population, there will be no economic development but retardation, (c) It does not reveal the social costs to society, (d) It explains nothing about the distribution of income in the economy, (e) There are certain conceptual difficulties in the measurement of GNP.

2. GNP Per Capita :
Some economists have taken per capita real income as an economic development indicator on the basis of the increase in per capita real income of the economy over a long period. The increase in per capita real income of any’country shows an increase in economic growth rate of the country rather than economic development. Economic development includes changes in many spheres besides a rise in per capita real income. This indicator emphasizes that for economic development, the rate of increase in real per capita income should be higher than the growth rate of population.

3. Welfare :
Other indicator of economic development is econqmic welfare. Economic development is regarded as a process whereby there is an increase in the consumption of goods and services of individuals. According to Okun and Richardson, economic development is “a sustained, secular improvement in material well-being, which we may consider to be reflected in an increasing flow of goods and services”.

4. Social Indicators or Basic Needs :
Certain economists have tried to measure economic development in terms of social indicators. Social indicators are referred to as the basic needs for development. Basic needs focus on alleviation of poverty by providing basic human needs to the poor. The direct provision of basic needs such as health, education, food, water, sanitation and housing affects poverty in a shorter period and with fewer monetary resources than GNP/GNP per capita strategy. Basic needs lead to a higher level of productivity and income through human development in the form of educated and healthy people.

Norman L.Hicks and Paul P.Streeten consider six social indicators for basic needs.

Basic NeedsIndicators
1. HealthLife expectancy at birth
2. EducationLiteracy signifying primary school enrolment as percent of population
3. FoodCalorie supply per head
4. Water supplyInfant mortality and percentage of . population with access to portable water.
5. SanitationInfant mortality and percentage of population with access to sanitation.
6. HousingNone


5. Physical Quality of Life Index (PQLI) :
It was invented by M.D. Morris in 1979. He constructed a composite Physical Quality of Life Index relating to 23 countries for a comparative study. This is a non-income indicator of economic development because this uses physical quality of life as ah indicator. This method of measuring economic development is based on the following three things. They are: (i) life expectancy, (ii) infant mortality rate, and (iii) basic literacy. This index mesures performance in meeting the most basic needs of people. This index represents basic needs such as health, education, drinking water, nutrition and sanitation.

6. Human Development Index (HDI) :
Mahbub-Ul-Haq developed the Human Devel-opment Index and UNDP incorporated it in its first Human Development Report in 1990. Since then, the UNDP is presenting the measurement of human development in its annual report.

Human Development Index (HDI) is a modem indicator of economic development. It is a statistical tool used to measure a country’s overall achievement in its social and economic dimensions. The following indicators are required to construct HDI:

  1. Life expectancy at birth.
  2. Education – adult literacy, combined gross enrolment ratio.
  3. Real GDP per capita based on purchasing power parity in terms of dollar.

For the construction of HDI, an index is created for each of these indicators with fixed minimum and maximum values for each of these indicators as shown below :

  • Life expectancy at birth, 25 years and 85 years.
  • Adult literacy rate, 0% and 100%.
  • Combined gross enrolment ratio, 0% and 100%
  • Real GDP per capita (PPP) $100 and $40,000.

India’s HDI value is shown in the following table :

YearHDI Value
19900.427@
19950.546
20010.472
20020.595
20070.612
20100.519
20130.586
20170.640 @
20180.647 β


7. Gender related Development Index (GDI) :
The HDR, 1995 introduced two global gender indices. These are Gender related Development Index (GDI) and Gender Empowerment Measure (GEM). The GDI is a composite, index which measures the average achievement of population in the same dimensions as the HDI while adjusting for gender inequalities in the level of achievement in the three basic aspects of human development. It uses same variables as the HDI, disaggregated by gender.

The greater the gender inequality in human development, the lower the GDI compared to HDI. The greater the difference between HDI and GDI, the more is the inequality. There is a greater awareness in the world about gender inequality and efforts are being made to reduce gender inequality. Women movements are promoting and working for gender equality.

8. The Social Progress Index (SPI) :
The SPI measures the extent to which a country provides for the social and environmental needs of their citizens. Fifty four indicators in the areas of basic human needs, foundations of well-being, and opportunity to progress show the relative performance of nations. The index is published by the non-profit Social Progress Imperative, and is based on the writings of Amartya Sen, Douglass North, and Joseph Stiglit2. The SPI measures the well-being of a society by observing social and environmental outcomes directly rather than the economic factors. The social and environmental factors include wellness, equality, inclusion, sustainability and personal freedom and safety.

9. Multi – dimensional Poverty Index (MPI) :
First introduced in 2010, it is an attempt designed to illustrate the many deprivations faced by the mpst severely disadvantaged. The MPI requires a household to be deprived in multiple indicators at the same time. A person is multi-dimensionally poor if the weighed indicators in which he or she is deprived add up to at least 33 per cent. The MPI is closely linked to the Millennium Development Goals and includes ten components.

  1. Possession of some assets,
  2. Nutrition
  3. Child morality
  4. Access to drinking water,
  5. Access to sanitation
  6. Access to a safe room,
  7. Access to electricity
  8. Access to an improved cooking oil,
  9. Years of schooling
  10. Children enrolled in school

10. Economic Growth :
It measures the annual increase in GDP, GNP and GDP per Capita or GNP per capita.

11. Gross National Happiness Index :
Countries like Bhutan are measuring their development with gross national happiness index. Hence, there is a need to bring a change in the existing method of measuring the development.

TS Inter 2nd Year Economics Study Material Chapter 1 Economic Growth and Economic Development

Question 4.
Explain the factors hindering economic development.
Answer:
1. Inadequate Natural Resources :
Developing countries are too populous. As such, serious shortage of land is a common phenomenon, which leads to many damaging effects. With lesser lands, there will be significant fall in cultivation activities, which are the main source of income in poor countries. This is being made worse with low level of technology, which could have helped them to produce on a mass scale.

a) Untapped Resources :
Many poor countries (Sub Saharan African) are blessed with natural resources. However, most of them are untapped. The reason is lack of research and development which may lead to low discovery of mineral deposits.

b) Inefficiently Managed Resources :
Many poor countries do not achieve both productive and allocative efficiency. Productive inefficiency exists due to absence of competition, contracts and projects are awarded to family members or to the persons having political patronage and government adopting a closed economy policy. Someone else can still be made better off without making someone else worse off. But globalization had changed the pattern of utilization of economic resources, where competition is encouraged and resources are flowing into the fields which are being efficiently managed.

2. Lower Rate of Growth of Human Capital :
Developing countries have low allocation of budget on education and health sector. Low spending on education means many will be unskilled. Lesser availability of healthcare means lower life expectancy, more days taken off as leave resulting in lower output and loss of workforce at productive age. In this regard Amartya Sen’s entitlements approach is noteworthy where education acquires a considerable amount of importance as a causative factor for capabilities of individuals where they can qualitatively contribute to development of the nation. Since LDCs have a dearth of critical skills and knowledge, physical capital cannot be utilised productively.

3. Lack of Infrastructure :
Due to many reasons, infrastructure development is far left behind. Nothing much has been done to improve the facilities like power, credit, telecommunications and transportation, which are key Services that will attract investment. Roads, bridges, harbours and railways are in less desirable condition and may adversely affect the timely delivery of goods.

1.4.4 Vicious Circles of Poverty :
Since an underdeveloped economy lacks the proper and modem means of economic development, its economic development becomes an uphill task. This situation can be summed up as “a country is poor because it is poor”.

The basic vicious circle stems from the fact that in developing countries total productivity is low due to deficiency of capital, market imperfections, economic backwardness and underdevelopment. The vicious circles operate both on the demand side and the supply side. The demand side of the vicious circle is that the low level of real income leads to a low level of demand which leads to a low rate of investment and hence back to deficiency of capital, low productivity and low income.

The following figure shows the supply side of the vicious circle is that the low pro-ductivity is reflected in low real income. This means low savings which lead to low invstment and to deficiency of capital. This leads to low level of productivity arid back to low income.
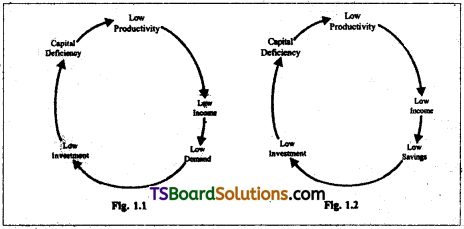
TS Inter 2nd Year Economics Study Material Chapter 1 Economic Growth and Economic Development 1

With structural changes, the vicious circles in many developing countries can be avoided and even some of the newly liberated African Countries are slowly heading in the growth path.

5. Low Rate of Capital Formation :
In LDCs the masses are poor, mostly illiterate and unskilled, use outdated equipment and production methods. Their marginal productivity is low which leads to low real income, low saving, low investment and to a low rate of capital formation. Small sums which they may be able to save are often hoarded or used in purchasing gold etc. Most of the savings are only from the high income group and these do not flow into productive channels due to their conspicuous consumption.

6. Socio – Cultural Constraints :
Social institutions and attitudes, traditional beliefs and values, rigid stratification of occupations, motives to save and invest, money spent to meet social obligations, nepotism, inefficient and bad administration, bribery, social attitude towards education, prejudice against manual work, oriental religions, high value for leisure and blind force of fate etc. are not conductive to economic development. These inhibit the progress in underdeveloped countries.

7. Agricultural Constraint :
The environment in which farmers operate the technology available to them, the incentives for production and investment, the availability and prices of input?, the provision of irrigation, the climate and the prices of agricultural products are the areas in which the constraints are to be foun.

8. Foreign Exchange Constraint :
Due to certain disequalising forces in the world economy, the gains from trade have gone to the developed countries and as a result foreign exchange constraint has taken place. There has been phenomenal rise in the exports of urn derdeveloped countries. But this has not contributed much to the development, as the export sector has developed by neglecting other sectors of the economy. Too much dependence on exports has exposed these developing countries to international fluctuations in the demand for and prices of their products. An improvement in their terms of trade is not accompanied by an increase in output and employment due to market imperfections, inadequate overhead capital and structural maladjustments.

Question 5.
Explain the factors promoting economic development.
Answer:
Factors Promoting Economic Development :
There are mainly two types of factors which influence the economic development of a country. They are

I. Economic Factors :
Economists regard factors of production as the main economic factors that determine growth or development. The growth rate of the economy rises or falls as a consequence of changes in them. These economic factors are discussed below.

1. Capital Formation :
When the capital stock increases with the passage of time, this is called capital formation. The strategic role of capital in raising the level of production has been acknowledged. The country which wants to accelerate the pace of growth has no choice but to save a high ratio of its income, with the objective of raising the level of investment unless otherwise it can attract foreign investment on a large scale.

Whatever be the economic system, a country cannot hope to achieve economic progress unless a certain minimum rate of capital accumulation is realized. The incremental capital- output ratio (ICOR), which refers to the additional amount of capital required to produce an additional unit of output, assumes greater importance in economic growth.

2. Natural Resources :
The principal factor affecting the development of an economy is the natural resources or land. In economics land includes the land area and the quality of the soil, forest wealth, minerals and oil resources, good climate and eco system, water and seta resources etc. For economic growth, the existence of natural resources in abundance is essential. A country which is deficient in natural resources may not be in a position to develop rapidly. In fact, natural resources are a necessary condition for economic growth but not a sufficient one. Japan and India are the two contradictory examples.

3. Agrarian Structure :
The agrarian system, where ownership of land becomes important besides the method of cultivation as they play an important role in bringing about economic development. Land reforms and modernization of agriculture through technological changes, improved inputs, marketing and credit are important for a faster agricultural growth of the economy.

4. Markatable Surplus of Agriculture :
The term ‘marketable surplus’ refers to the excess of output in the agricultural sector over and above what is required to allow the rural population to subsist. However, the marketed surplus is an indicator of progress in agriculture sector.

The importance of the marketable surplus in a developing economy emanates from the fact that the urban industrial population subsists on it. With the development of an economy, the ratio Of the urban population increases. As a result demand increases for food grains. This demand must be met adequately; otherwise, the consequent scarcity of food in urban areas will arrest the economic growth.

5. Industrial Structure :
The industrial structure demands the relative importance of large scale, small scale and cottage industries and the level of technology being used in these industries. A change in the structure where modernization takes place due to adoption of recent technological advances will lead to a higher tempo of economic development in the developing economies.

6. Structural Changes :
Structural changes imply the transition from a traditional agricultural society to a modem industrial society involving a radical transformation of existing institutions, social attitudes and motivations. These changes lead to increasing employment opportunities, higher labour productivity, the stock.of capital, exploitation of new resources and improvement in technology.

7. Organisation :
It is an important aspect of the growth process. It relates to the optimum use of factors of production in the economic activities. The entrepreneur is performing the task of an organiser and undertaking risks and uncertainties in the business. But less developed countries lack in entrepreneurial activity and less developed countries should create a climate for encouraging entrepreneurship. For this, the provision of all the required social, economic and technological institutions is necessary.

8. Technological Progress: Technological changes are related to changes in the production methods which are the result of new innovations. Changes in technology lead to increase in the productivity of labour, capital and other production factors. Schumpeter and Kuznets regarded innovation as the most important technological factor in economic growth. The spending of high percentage of national income on Research and Development is required.

9. Division of Labour :
Adam Smith gave much importance to the division of labour in economic development. But division of labour depends upon the size of the market. When the scale of production is large there is greater specialisation and division of labour. The growth prodess in less developed countries can be accelerated by widening of the market through adoption of modem means of transport and communications.

10. Foreign Trade :
Foreign trade has proved to be beneficial to countries, which have been able to set-up industries in a relatively short period. These countries like Japan and South Korea eventually captured international markets for their industrial products. Therefore, a developing country should not only tiy to become self-reliant in capital equipment and other industrial products as early as possible, but it should also push the development of its industries to such economy and yet face no difficulty in making economic progress. In today’s entirely different world situation, a country would find it difficult to grow along this path of development.

II. Non – Economic Factors :
It is obvious that non-economic factors are also equally important in development as economic factors. Let us tiy to understand how they influence the process of economic development:

1. Human Resources :
Human resources are considered as very important factor in economic development. Human being provides labour power for production and if in a country’s labour is efficient and skilled, its capacity to contribute to growth will be high. The productivity of illiterate, irrational, unskilled, disease ridden, superstitious people is generally low and they do not provide much to development in a country. In case either human resources remain unutilized or the labour management remains defective, it will be a burden on the economy.

Efficiency or Productivity of labour force depends upon health, education and social services. The level of technical expertise has a direct bearing on the development. As the scientific and technological knowledge advances, man discovers more sophisticated techniques of production which steadily raise the productivity levels.

2. Political and Administrative Factors :
Dadabhai Naoroji has also explained in his classic work ‘Poverty and Un British Rule in India’ that the drain of wealth and capital from India under the British rule -/as the major cause for absence of development in India during that period.

‘Political and administrative factors also helped in modem economic growth. The eco- npmic growth of Britain, Germany, the United States, Japan and France is due to their.politi- cal stability and strong administration. But, Italy has not been able to grow upto their level due to political instability and corrupt and weak administration. Peace, protection and stability have encouraged the development of entrepreneurship in developed countries, along with the adoption of appropriate monetary and fiscal policies.

3. Social Factors :
Social attitudes, values and institutions also influence economic growth. Attitudes are beliefs and values that cause human behaviour to be “What it is”. Values refer to motivations of human behaviour towards particular ends. Myrdal advocates the adoption of modernization values for the rapid economic development of less developed countries.

Changes in attitudes due to modernization of values lead to development of the agricultural, industrial and tertiary sectors of the economy. , But the development of these sectors is hot possible without, entrepreneurship. According to Myrdal, less developed countries lack entrepreneurship because they are deficient in persons with right attitude for entrepreneurship.

Mass participation in development programmes is a pre-condition for accelerating the growth process. However, people show interest in the development activity only when they feel that the fruits of growth will be fairly distributed. Experiences from a number of countries suggest that whenever the defective social system allows some elite groups to appropriate the benefits of growth, the general mass of people develop apathy towards State’s development programs. Under those circumstances, it is futile to hope that masses will participate in the development projects undertaken by the State. India’s experience during the whole period of development planning is an example.

TS Inter 2nd Year Economics Study Material Chapter 1 Economic Growth and Economic Development

Question 6.
Discuss the characteristics of Developed Countries.
Answer:
Characteristics of Developed Economies
Based on their GNI per capita, countries are classified as low income, middle income and high income countries. Income classifications are set each year on July 1. These official analytical classifications are fixed during the World Bank’s fiscal year (ending on June 30). According to World Bank Report (2014) entitled “Risk and Opportunity Managing Risk for Development”, the world economies have been divided into four types based on per capita GNI $ (dollar) value i.e.,

  • Low Income Economy – US$ 1035 or less than it
  • Low Middle Income Economy – US$1036 – US$4085
  • Upper Middle Income Economy – US$4086 – US$12615
  • High Income Economy – US$12616 and more

A developed economy is characterized by an increase in capital resources, improvement in efficiency of labour, better organization of production in all spheres, development of means of transport and communication, growth of banks and other financial institutions, urbanization and a rise in the level of living, improvement in the standards of education and expectation of life, greater leisure and more recreation facilities and the widening of the mental horizon of the people and so on. In short, economic development must break the poverty barrier or the vicious circle and bring into being a self-generating economy so that economic growth becomes self-sustained.

The main characteristics of developed countries are as follows :

1. Significance of Services and Industrial Sector :
Most of the developed countries have given much .importance to the development of industrial sector. They have large capacities to utilize all resources of production, to maximize national income and to provide employment for the jobless people. As per the sectoral contribution to GDP these countries receive the major portion of their GDP from the non-agriculture sectors which include industry and services. For instance, in 2014 the U.K. received 79.6 per cent of her GDP from the services, 19.8 per cent from the industry and 0.6 per cent from agriculture. The same is the case with the U.S.A., Japan and other west European countries.:

Similarly, coming to employment, in 2011 just 1 per cent of employment was in agriculture in the U.K. and this was 47 per cent in Indian agriculture.

2. High Rate of Capital Formation :
Developed countries are generally very rich as they maintain a high level of savings and investment, with the result that they have huge amount of capital stocks. Gross capital formation will be more in these developed countries. Well-developed capital markets, high level of savings, broader business prospects as well as innovative entrepreneurship have led to a high growth of capital formation in these economies. Such a situation can be observed with the help of following table :

Country1990 2018
USA1821
UK2017
GERMANY2422
JAPAN3324
CHINA3544

A higher rate of gross capital formation alone can pave the way for economic development.

3. Use of Modern Production Techniques and Skills :
The new and advanced techniques have been used for the exploitation of the physical human resources. These countries have, therefore, been giving priority to the scientific research so as to improve and evolve the new techniques of production. Consequently, these countries find themselves able to produce goods and services of a better quality at a comparatively lesser cost. It is because of the use of modem and mass production techniques and latest skills, that the countries like Japan, Germany and Israel could have developed their economies very rapidly, though they have limited natural resources. This was shown in the following table

Expenditure on R & D

CountryExpenditure on R & D as % of GDP 2017
USA2.80
UK1.67
SWITZERLAND3.37 (2015)
GERMANY3.04
JAPAN3.20
INDIA0.62 (2015)
CHINA2.1

It is clear that the Switzerland spent 3.37 per cent of its GDP on Research & Development (R & D) during 2015, whereas India spent only 0.62 per cent of its GDP on R & D in 2015.

4. Low Growth of Population :
The developed countries, like the U.S.A., the U.K. and other western European countries have low growth of population because they have low level of birth rate followed by low level of death rate. Good health conditions, high degree of education and higher level of consumption of the people have led to maintain low growth of population. The life expectancy in these countries is also very high. The average annual growth rate of population in developed countries is 0.7 percent as compared with 2 percent in developing countries.

Average life expectancy at birth is 75 years in the developed countries whereas in the developing countries it is 51 years. Besides this, the entire society, its structure and values are found to be more conductive to the goal of rapid industrial and economic development. Further, dignity of labour is maintained. The economic motive and strong desire to lead a better social life always inspire people to contribute greatly to the process of development.

5. Higher Per Capita Gross National Income in $ (Purchasing Power Parity) :
One of the important features of the developed economies is the higher per capita national income, which can be seen from the table given below.

Per Capita Gross National Income at Market Prices (In US Dollars), 2018

CountryPer capita GNI
Purchasing Power Parity Basis
USA63,690
UK45,350
SWITZERLAND68,820
GERMANY54,650
JAPAN44,380
CHINA18,170
INDIA7,680

It is evident from the above table that the per capita GNI of USA in the year 2018 was US $ 63,690, UK was $ 45,350 and Switzerland $68,820, whereas India’s GNI was $7,680. It indi-cates that the developed countries are endowed with higher per capita GNI. It may be noted that in 2018 the average per capita GNI of USA at the purchasing power parity rates was 8.3 times that of India.

TS Inter 2nd Year Economics Study Material Chapter 1 Economic Growth and Economic Development

Question 7.
Analyse critically the characteristics of developing economics with special reference to India.
Answer:
Characteristics of Developing Economies with Special Reference to India :

The major characteristics of developing economies in general and the Indian economy in particular are as follows :
1. Low Per Capita Income :
According to Caimcross, “the underdeveloped countries are the slums of the world economy”.

The per capita NNP in India in 1995-96 was about Rs. 9,300 and in 2012-13 it was Rs. 22,000. It is one of the lowest in the world. Among the 133 countries of the world, India’s rank is 110. The per.capita GNI of an Indian in 2018 was $ 7680 at the purchasing power parity v rates. In the same year the average per capita GNI of USA is 8.3 times that of India. Whatever progress has been made in terms of the increase in production since independence, the same is not reflected in increase in per capita income because of rapid growth of population along with the growth of production.

This means that a large proportion of population have income level much below the average. For instance, according to the Rangarajan Committee’s estimates, 29.5 percent of total population in 2011-12 were living below the poverty line i.e. they are not able to afford even the minimum nutrition required. Due to the low level of living, the efficiency of labour is also low.

2. Predominance of Agriculture :
In developing countries two-thirds or more of the people live in rural areas and their main occupation is agriculture. Agriculture is mostly unproductive.

In India, 42.7 per cent of the working population was engaged in agriculture in 2017 and its contribution to the gross value added (GVA) is 16.5 percent in 2019-20 (Economic Survey, 2019-20). Rainfall is the main source of irrigation. The technology used in agriculture is traditional in nature and modernization is slowly taking place. Although in some areas modem techniques of cultivation are in application, still the vast agricultural area uses primitive techniques of cultivation. A’ vast area of agricultural land is still not covered by irrigational facilities. Agriculture continues to be a depressed industry as the productivity per person engaged in it is very low.

3. Capital Deficiency :
Developing countries are characterized as “capital-poor or low- saving and low investing” economies.

The low level of income results in low level of savings, which results in low level of capital formation. For want of capital, other resources like labour and natural resources remain unutilized. India has a large potential for renewable as well as non-renewable resources. The country is not able to utilize them fully for want of capital. As per Annual Report of RBI 2019, in 2017-18, gross domestic saving (GDS) rate is 30.1 percent and gross domestic investment (GDI) rate is 32.3 per cent at current prices.

4. Technological Backwardness :
Deficiency of capital hinders the process of scrapping off the old techniques and the installation of modem techniques. Illiteracy and absence of a skilled labour force are the other major hurdles in the spread of techniques in the backward economy. The technological backwardness is not only the cause of economic backwardness, but also the result of it.

In large parts of almost all sectors of the Indian economy, technology used in production is backward.. The expenditure incurred on research and development is low. Advanced technology is in use in a few industries only. With the liberalisation of the economy, new technology is being adopted by a large number of enterprises for their survival.

5. Inadequate Infrastructure Facilities :
Infrastructural facilities include banking, education, public health, drinking water, drainage, irrigation, power, transport and communications. These facilities are essential for the development of agriculture, industrial and services sectors. All these facilities are inadequate.

6. Demographic Features :
The average annual growth rate of population in developing countries is 2 percent as compared with about 0.7 percent in developed countries. The percentage of population under 15 years of age is about 40 in developing countries, compared with only 20 to 25 percent iii developed countries. Average life expectancy at birth is roughly 51 years in developing countries whereas in the developed countries it is 75 years. It is 68.5 years in India as per 2011 census. As per HD report 2019, it is 69.4 years in 2018.

The density of population in India in 2006 was 373 per sq.km as compared with 33 in USA and 141 in China. The number of deaths of infants of less than one year of age per thousand live births in India was 44 in 2010. This shows the inadequate medical facilities, low level of nutrition and poor sanitary conditions.

India’s population is very large, it is 129.5 crores in 2014, and it is rising at a rate of 1.64 per cent (2011) per annum.

7. High Rate of Illiteracy :
Most of the underdeveloped countries suffer from mass illiteracy. Illiteracy retards development. A minimum level of education is necessary to acT quire skills. India ranked at the 129th positon in 2018 on the basis of the Human Development Index which is based on life expectancy, adult literacy, combined enrolment ratio, an?l real GDP per capita in US Dollars.

Illiteracy rate in females is much higher than in males. In India as per 2011 census literacy rate, male literacy rate and female literacy rate (percent) are 74.0, 82.14 and 65.5 respectively.

8. A Dualistic Economy :
Almost all developing containing have a dualist economy.

Dualism is also characterised by the existence of an advanced industrial system and an indigenous backward agricultural system. The industrial sector uses capital intensive techniques and produces a variety of capital goods and durable consumer goods. The rural sector with traditional techniques is producing agricultural commodities. There is also financial dualism consisting of the unorganised money market with very high interest rates on loans and the organised money market with low interest rates and abundant credit facilities.

9. Underdeveloped Natural Resources :
Underdeveloped countries have not been suc-cessful in over coming the scarcity of natural resources by appropriate changes in technology and social and economic organization. The natural resources are underdeveloped due to various inhibitions such as their inaccessibility, lack of technical knowledge, non availability of capital and the small extent of the market.

10. Lack of Entrepreneurship :
Another feature of underdeveloped countries is the lack of entrepreneurial ability. Entrepreneurship is inhibited by the social system which denies opportunities of creative faculties. The small size of the market, lack of capital* lack of infrastructural facilities, technological backwardness, absence of private property, absence of freedom of contract and law and order hamper enterprise and initiative.

11. Unemployment and Disguised Unemployment :
In underdeveloped countries there is vast open unemployment and disguised unemployment. The unemployment is spreading with urbanisation and the spread of education. But the industrial sector has failed to expand along with the growth of labour force. In India unemployment is structural and is the result of a deficiency of capital. In under developed countries under employment or disguised or concealed unemployment is a notable feature. In Indian agricultural sector, a much larger number of labourers are engaged than are really needed. The marginal product of labour in agriculture is negligible or it may be zero or may be negative.

The Eleventh Plan (2007-12) has a backlog of 37 million unemployed and estimated that 45 million are likely to be the new entrants to the labour force during this plan. Unemployment reached to 6.1 percent in 2017-18. Thus, the provision of employment becomes a major task of the planning process in India.

12. Social Institutions s In developing countries social institutions are not conducive to economic development. The Indian society is divided into many castes and sub-castes resulting in frictions in the society. The religious and social beliefs and customs to certain extent inhibit the development of scientific attitudes. People are conservative and superstitious and governed by customs and traditions. Joint family system and the caste system obstruct mobility Of labour.

13. Foreign Trade Orientation :
Underdeveloped economies are generally foreign trade oriented. These countries export primary products and import consumer goods and machinery. This too much dependence on exports of primary products leads to serious repercussions in their economies in the forms of neglecting other sectors, susceptible to international fluctuations. Developing countries are facing with the balance of payments difficulties. In India the recent rapid increase in the import bill together with stagnating exports has led to a significant worsening of the trade balance (US $ – 180.3 billions in 2018-19).

Short Answer Questions

Question 1.
Define economic growth and write its essential aspects.
Answer:
Economic growth is a narrower concept than economic development. It is an increase in a country’s real national output which can be caused by an increase in the quality of resources. Economic growth can be measured by an increase in a country’s gross domestic product (GDP).

According to Michael P. Todaro, “Economic growth is a steady process by which the productive capacity of the economy is increased over a time to bring about rising levels of national output and income”.

According to Simon Kuznets, “Economic growth may be defined as a long term process where in the substantial and sustained rise in real national income, total population and real per capita income takes place”.

According to Maddison, “The raising of income levels is generally called economic growth in rich countries and in poor ones it is called economic development”.

John Friedmann defines growth as an expansion of the system in one or more dimensions without a change in its structure.

Essentials of Economic Growth
From the above stated definitions, the essential features of economic growth can be explained as given here under:

  1. Economic growth shows a higher rate of increase in real per capita income than the rate of growth of population.
  2. Economic growth is always linked with a large increase in productive ability of the economy.

In short-run, economic growth is measured with the help of rate of saving and capital- output ratio, while in the long run it is measured with the help of increase in labour force and technological growth. Thus the four determinants of economic growth can be understood as (a) rate of saving of the economy; (b) capital-output ratio, where the stock of capital is divided by output; (c) rate of growth of labour force and (d) rate of growth of technological progress.

TS Inter 2nd Year Economics Study Material Chapter 1 Economic Growth and Economic Development

Question 2.
Explain the structural changes in economic development.
Answer:
Economic development represents structural changes in various sectors of the country: There will be a change in the occupational structure. In economic development there will be a decrease in the share of labour force in primary sector and an increase in the shares of labour force in secondary sector and tertiary sector. The structural changes can be seen as follows :

1. There will be a change in the structure of national output. The contribution of primary sector in the national output falls and the shares of secondary and tertiary sectors slowly go up.

2. There will be a change in the structure of industrial production. There will be an increase in the production of capital goods vis-a-vis the production of consumer goods.

3. There will be a change in the structure of foreign trade. The share of primary goods in exports decreases and the share of capital goods in imports increases. Accordingly, in economic development there will be an increase in exports of manufactured and final goods as well as services. Similarly, there will be a decrease in the imports of consumer items. In present context of globalization, the developing countries are also actively participating in world agricultural trade, where agricultural exports are being given importance, besides limiting the importation of consumer items. But this cannot be considered as a reversal of the earlier trend in all the developing countries.

4. There will be a change in the structure of technology. In economic development, modem and advanced techniques of production’are used in all the sectors of economy.

5. There will be a change in the social and institutional sectors. Due to economic devel-opment there will be an increase in the self-esteem and living standards of the population.

In brief economic development is economic growth coupled with ‘change’. The term change’ here refers to the qualitative changes in the economy. These are in the form of im-provement in the level of living, reduction in inequalities in income and wealth, rise in efficiency, improvement in technique, faster growth of industrial sector, positive changes in attitudes and other concomitant changes in all the economic spheres.

Question 3.
Distinguish between economic development and economic growth.
Answer:
The distinction between economic growth and development is presented below :

Economic GrowthEconomic Development
1. Economic growth refers to an irlcrease in a country’s real output of goods and services.1. Economic development refers not only to economic growth but also about progressive changes in the socio-economic structure of a country.
2. Economic growth is a single dimensional phenomenon.2. Economic development is a multidimensional phenomenon.
3. Economic growth explains primarily about quantitative changes in the economy.3. Economic development explains quantitative as well as qualitative changes in the economy.
4. Economic growth occurs either through actie role of government or not.4. In the initial stages of development, governmental intervention is desirable in view of low level of output in the country and hence an active role is important for development.
5. Faster economic growth occurs when ‘ more technological progress occurs.5. A higher level of economic development entails improement in the quality of life of the people.
6. Economic growth is the key issue under traditional economics. According to this approach “take care of growth, and poverty would be eliminated automatically.” This is called as the trickle down approach.6. Economic development is the main issue under modern economics. Accordingiy, “take care of poverty, and growth would take care of itself.”
7. The scope of economic growth is narrow because it is concerned with changes in per capita income level only.7. Scope of economic development is wide and comprehensive than economic growth. Its link is not only with an increase in income but also with the well being of the economy.
8. Economic growth is considered as short-term process where we can measure income changes on an yearly basis. So, its time span may be of one year.8. Economic development is a longterm process that spans about 20 to 25 year’s. It takes more years to change social, economic and institutional set-up.
9. Economic growth is more relevant concept in the case of developed countries.9. Economic development is the main issue of developing countries.
10. There may or may not be any social change in case of economic growth. It is only concerned with change in income level without giving due consideration to social change.10. Social changes, in case of economic development, are compulsory. It refers to the better jobs, availability of food, better health and education and a sustained increase in living standards where enrivonmental issues are also given a due consideration.
11. Economic growth does not indicate the distribution of income and wealth in the economy.11. Economic development indicates the distribution of income and wealth in the economy.
12. Economic growth is measured only by comparing income levels of different years. It is usually measured by comparing the rate of economic growth for every year.12. Measurement of economic, development is based on the computation of composite indices where reduction in poverty, development of human beings and living standards play an important role.

TS Inter 2nd Year Economics Study Material Chapter 1 Economic Growth and Economic Development

Question 4.
Explain the economic factors promoting development.
Answer:
Factors Promoting Economic Development :

There rre mainly two types of factors which influence the economic development of a country. They are

I. Economic Factors :
Economists regard factors of production as the main economic factors that determine growth or development. The growth rate of the economy rises or falls as a consequence of changes in them. These economic factors are discussed below.

1. Capital Formation :
When the capital stock increases with the passage of time, this is called capital formation. The strategic role of capital in raising the level of production has been acknowledged. The country which wants to accelerate the pace of growth has no choice but to save a high ratio of its ificome, with the objective of raising the level of investment unless otherwise it can attract foreign investment on a large scale.

Whatever be the economic system, a country cannot hope to achieve economic progress unless a certain minimum rate of capital accumulation is realized. The incremental capital- output ratio (ICOR), which refers to the additional amount of capital required to produce an additional unit of output, assumes greater importance in economic growth.

2. Natural Resources :
The principal factor affecting the development of an economy is the natural resources or land. In economics land includes the land area and the quality of the soil, forest wealth, minerals and oil resources, good climate and eco system, water and sea resources etc. For economic growth, the existence of natural resources in abundance is essential. A country which is deficient in natural resources may not be in a position to develop rapidly. In fact, natural resources are a necessary condition fpr economic growth but not a sufficient one. Japan and India are the two contradictory examples.

3. Agrarian Structure :
The agrarian system, where ownership of land becomes important besides the method of cultivation as they play an important role in bringing about economic development. Land reforms and modernization of agriculture through technological, changes, improved inputs, marketing and credit are important for a faster agricultural growth of the economy.

4. Markatable Surplus of Agriculture :
The term ‘marketable surplus’ refers to the excess of output in the agricultural sector over and above what is required to allow the rural population to subsist. However, the marketed surplus is an indicator of progress in agriculture sector. .

The importance of the marketable surplus in a developing economy emanates from the fact that the urban industrial population subsists on it. With the development of an economy, the ratio of the urban population increases. As a result demand increases for food grains. This demand must be met adequately; otherwise, the consequent scarcity of food in urban areas will arrest the economic growth. .

5. Industrial Structure :
The industrial structure demands the relative importance of large scale, Small scale and cottage industries and the level of technology being used in these industries. A change in the structure where modernization takes place due to adoption of recent technological advances will lead to a higher tempo of economic development in the developing economies.

6. Structural Changes :
Structural changes imply the transition from a traditional agricultural society to a modem industrial society involving a radical transformation of existing institutions, social attitudes and motivations. These changes lead to increasing employment opportunities, higher labour productivity, the stock of capital, exploitation of new resources and improvement in technology.

7. Organisation :
It is an important aspect of the growth process. It relates to the optimum use of factors of production in the economic activities. The entrepreneur is performing the task of an organiser and undertaking risks and uncertainties in the business. But less developed countries lack in entrepreneurial activity and less developed countries should create a climate for encouraging entrepreneurship: For this, the provision of all the required social, economic and technological institutions is necessary.

8. Technological Progress :
Technological changes are related to changes in the production methods which are the result of new innovations. Changes in technology lead’to increase in the productivity of labour, capital and other production factors. Schumpeter and Kuznets regarded innovation as the most important technological factor in economic growth. The spending of high percentage of national income on Research and Development is required.

9. Division of Labour :
Adam Smith gave much importance to the division of labour in economic development. But division of labour depends upon the size of the market. Whe,n the scale of production is large there is greater specialisation and division of labour. The growth process in less developed countries can be accelerated by widening of the market through adoption of modem means of transport and communications.

10. Foreign Trade :
Foreign trade has proved to be beneficial to countries, which have been able to set-up industries in a relatively short period. These countries like Japan and South Korea eventually captured international markets for their industrial products. Therefore, a developing country should not only try to become self-reliant in capital equipment and other industrial products as early as possible, but it should also push the development of its industries to such economy and yet face no difficulty in making economic progress: In todays entirely different world situation, a country would find it difficult to grow along this path of development.

Question 5.
Explain the Non-Economic Factors promoting development.
Answer:
Non- Economic Factors
It is obvious that non-economic factors are also equally important in development as economic factors. Let us try to understand how they influence the process of economic development:

1. Human Resources :
Human resources are considered as very important factor in economic development. Human being provides labour power for production and if in a country’s labour is efficient and skilled, its capacity to contribute to growth will be high. The productivity of illiterate, irrational, unskilled, disease’ ridden, superstitious people is generally low and they do not provide much to development in a country. In case either human resources remain unutilized or the labour management remains defective, it will be a burden on the economy.

Efficiency or Productivity of labour force depends upon health, education and social services. The level of technical expertise has a direct bearing on the development. As the scientific and technological knowledge advances, man discovers more sophisticated techniques of production which steadily raise the productivity levels.

2. Political and Administrative Factors :
Dadabhai Naoroji has also explained in his classic work ‘Poverty and Un British Rule in India’ that the drain of wealth and capital from India under the British rule was the major cause for absence of development in India during that period.

‘Political and administrative factors also helped in modem economic growth. The economic growth of Britain, Germany, the United States, Japan and France is due to their political stability and strong administration. But, Italy has not been able to grow upto their level due to political instability and corrupt and weak administration. Peace, protection and stability have encouraged the development of entrepreneurship in developed countries, along with the adoption of appropriate monetary and fiscal policies.

3. Social Factors :
Social attitudes, values and institutions also influence economic growth. Attitudes are beliefs and values that cause human behaviour to be “What it is”. Values refer to motivations of human behaviour towards particular ends. Myrdal advocates the adoption of modernization values for the rapid economic development of less developed countries.

Changes in attitudes due to modernization of values lead to development of the agricultural, industrial and tertiary sectors of the economy. But the development of these sectors is not possible without entrepreneurship. According to Myrdal, less developed countries lack entrepreneurship because they are deficient in persons with right attitude for entrepreneurship.

Mass participation in development programmes is a pre-condition for accelerating the growth process. However, people show interest in the development activity only when they feel that the fruits of growth will be fairly distributed. Experiences from a number of cpuntries suggest that whenever the defective social system allows some elite groups to appropriate the benefits of growth, the general mass of people develop apathy towards State’s development programs. Under those circumstances, it is futile to hope that masses will participate in the development projects undertaken by the State. India’s experience during the whole period of development planning is an example.

TS Inter 2nd Year Economics Study Material Chapter 1 Economic Growth and Economic Development

Question 6.
Explain the physical quality life Index (PQLI)
Answer:
Physical Quality of Life Index (PQLI)

It was invented by M.D. Morris in 1979. He constructed a composite Physical Quality of Life Index relating to 23 countries for a comparative study. This is a non-income indicator of economic development because this uses physical quality of life as an indicator. This method of measuring economic development is based on the following three things. They are : (i) life expectancy, (ii) infant mortality rate, and (iii) basic literacy. This index measures performance in meeting the most basic needs of people. This index represents basic needs such as health, education, drinking water, nutrition and sanitation.

If in any country PQU is increasing then it indicates the increase in the physical quality of life of the people with increase in life expectancy, fall in infant mortality rate and rise in basic literacy rate. Increase in per capita income does not necessarily indicate the increase in the facilities like health, food, sanitation and education. Therefore, PQU method is taken to be a better indicator than per capita income method. The PQU measures quality of life directly and points towards that indicator which requires immediate action.

The PQU has certain limitations. These are :
a) Morris admits that PQU is a limited measure of basic needs.
b) It does not explain the changing structure of economic and social organisation.
c) it does not measure total welfare.
d) Equal weights are given to the three variables of PQU.

Question 7.
Discuss the human development Index (HDI) How it is measured.
Answer:
Human Development Index (HDI) :
Mahbub – UI – Haq developed the Human Development Index and UNDP incorporated it in its first Human Development Report in 1990. Since then, the UNDP is presenting the measurement of human development in its annual report.

Human Development Index (HDI) is a modern indicator of economic development. It is a statistical tool used to measure a country’s overall achievement in its social and economic dimensions. The following indicators are required to construct HDI:

  1. Life expectancy at birth.
  2. Education – adult literacy, combined gross enrolment ratio.
  3. Real GDP per capita based on purchasing power parity in terms of dollar.

For the construction of HDI, an index is created for each of these indicators with fixed minimum and maximum values for each of these indicators as shown below :

  • Life expectancy at birth, 25 years and 85 years.
  • Adult literacy rate 0% and 100%
  • Combined gross enrolment ratio, 0% and 100%
  • Real GDP per capita (PPP) $ 100 and $40,000-

For the components of the HDI, individual indices are calculated according to the following formula.

TS Inter 2nd Year Economics Study Material Chapter 1 Economic Growth and Economic Development 2

Then, the HDI is calculated as a simple average of the three dimension indices. HDI value ranges from zsero to one. Countries with HDI below 0.5 are considered to have a low level of human development, those between 0.5 to 0.8 a medium level and those above 0.8 a high level. But as per Human Development Report 2014 (HDI, 2013) Countries have been grouped under four categories, (i) Countries in the HDI 0.8 and above are in the very high Human development group, (ii) Countries in HDI range 0.7 to 0.8 are in the High Human Development group, (iii) Countries in the HDI range 0.5 to 0.7 are in the range of Medium Human development group and (iv) Countries in the HDI range less than 0.5 are in the low. Human Development group. India’s HDI value is shown in the following table :

YearHDI Value
19900.427
19950.546
20010.472
2002 0.592
20070.612
20100,519
20130.586
20170.640
20180.647

Very Short Answer Questions

Question 1.
Economic growth.
Answer:
Increase in the real output of goods and services over a long period of time is known as economic growth. It is a narrow concept. It explains quantitative changes. It relates to developed countries.

Question 2.
Economic Development.
Answer:
The Institutional changes and Tecyhnological changes which are used to achieve some amount of goods and services is known as economic development. It is a wider concept. It relates to developing countries.

Question 3.
Self Reliance.
Answer:
Self reliance implies that a country generates sufficient surplus to buy what it needs. It does not depend upon other countries for the resources of funds needed to acquire them. Self reliance allows imports.

Question 4.
Sustainable development.
Answer:
This concept was given by Brutland commission in the year 1987. It means to meet the needs of present generations, without comprising the ability of future generations.

TS Inter 2nd Year Economics Study Material Chapter 1 Economic Growth and Economic Development

Question 5.
Inclusive growth.
Answer:
Inclusive growth refers to both the pace and the pattern of the economic growth. This concept stresses the inclusiveness of the higher to scheduled population in the growth process, which is respected to bring in several other benefits as well to the economy. If the bottom 20% share can increase to 5 to 10% at lease, then it can be termed as inclusive growth.

TS Inter 2nd Year Economics Study Material Chapter 1 Economic Growth and Economic Development

Question 6.
Physical quality of Life Index (PQLI).
Answer:
If refers to physuical quality of life index. This concept can be studied with 3 ideas.

  1. Life expectancy – 65%
  2. Literacy Rate -.74%
  3. Infant molality rate 61/1000 live birth

This is a non income indicator of Economic development.

Question 7.
Human development Index (HDI).
Answer:
It refers to Human Development index. This concept measures the average achievement in three basic dimensions of human development. They are life expectancy at birth, adult literacy contained enrolment ratio and real GDP percapita based on purchasing power purity (PPP),

Question 8.
Gender related Development Index.
Answer:
This concept was introduced by Human development report (HDR) 1995. This concept is a composite index which measures the average achievement of population in the same dimensions as the HDI while adjusting for gender inequalities in the level of achievement in the three basic aspects of human development. It uses same variables as the HDI while adjusting for gender inequalities in the level of achievement in the three basic aspects of human development. It uses same variables as the HDI, dis eggregated by gender.

Question 9.
Social Progress Index (SPI).
Answer:
SPI is published by the non-profit social progress imperalised and it is based on the workings of Amartya Sen. This concept measures the well being of a society by observing social and environmental outcomes directly rather than the economic factors. The social and environmental factors include wellness, equality, inclusion, sustainability and personal freedom and safety.

Question 10.
Multi dimensional poverty Index (MPI).
Answer:
This concept was first introduced in the year 2010. It is an attempt designed to illustrate the many deprivations faced by the most several disadvantages. This concept requires a household to be deprived in multiple indicators at the same time. A person is multi dimensionally poor if the weighed indicators in which he or she is seprives add up to at least 33 percent.

Question 11.
Natural resources.
Answer:
Natural resources refers to land are and quality of soil forest wealth, good river system, minerals and Oil resources and ecosystem are included. For economic growth the existence of natural resources in abudance is essential.

Question 12.
Human Capital.
Answer:
Investment on human is called human capital most of the developing countries the people are illiterate. Their standard of living and mobility of labour is very low. The attitude and values of people do not encourage economic change and growth.

Question 13.
Vicious circles of poverty.
Answer:
A country is poor language it is poor. This concept was given by Ragnar Nurksc. The basic vicious circle stems from the fact that in developing countries total productivity is low and to deficiency of capital, market imperfections, economic backwardness and under development.

The vicious circle operates both on demand side and supply side. The demand side is that the low level of real income leads to a low level of demand the supply side, is that the low productivity reflected in low real income.

Question 14.
Capital formation.
Answer:
It refers to the net addition of capital stock such as equipment, buildings and other intermediate goods. A nation uses capital stock in combination of labour to provide services and to produce goods. An increase in this capital stock is known as capital formation.

Question 15.
Markatable surplus of agriculture.
Answer:
In refers to the success of agricultural output over and above what is required for subsistence living of the rural population. In case a country fails to produce a sufficient markable surplus it will be left with no choice select to import food grains which may cause a balance at payments problem.

TS Inter 2nd Year Economics Study Material Chapter 1 Economic Growth and Economic Development

Question 16.
Social factors.
Answer:
Social attitudes, values, and institutions also influence economic growth. These are rationality in throughout and action through on deliberate cultivation of scientific attitude and application of modem technology in order to increase productivity, raise levels of living and brings about social and economic equalisation, changes in attitudes due to modernisation of values lead to development of agriculture, industry and tertiary sectors of the economy.