Telangana TSBIE TS Inter 2nd Year Economics Study Material 3rd Lesson National Income, Poverty and Unemployment Textbook Questions and Answers.
TS Inter 2nd Year Economics Study Material 3rd Lesson National Income, Poverty and Unemployment
Essay Questions
Question 1.
Explain the trends in National Income of India.
Answer:
National income trends reflect the progress of the economy over time. The structural change in the composition of national income by industrial origin is the consequence of the process of economic growth initiated duripg the plans. At present, service sector is the pre-dominant source of the national income in India. National income is produced in public sector as well as private sector. Prior to 1951, the share of public sector was very small. Since the inception of planning, the share of public sector in national income has gradually increased.
A study of trends in national income is necessary to understand the impact On economic growth in India. It would be, therefore, better if the trends in national income and changes in the structure of national product are analysed over the last 68 years.
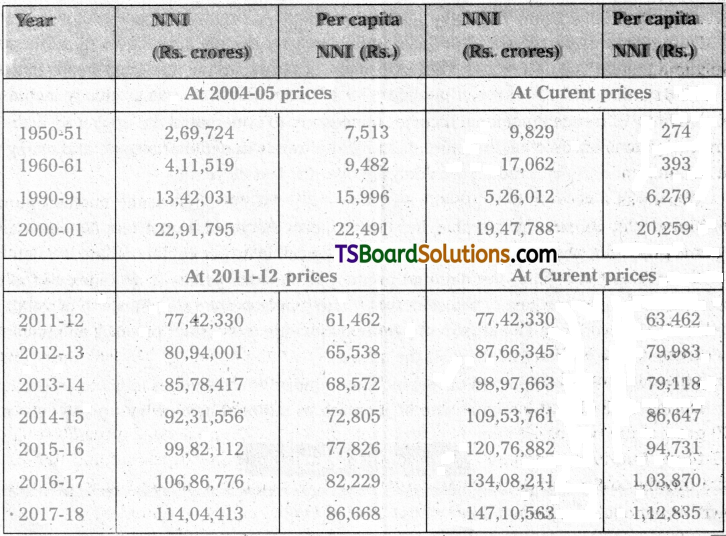
Trends in Net National Product and Per Capita Income :
National income figures at constant prices, become comparable, but they conceal the population effect. To eliminae the ‘ effect of growth of population, per capita national product or per capita income Is calculated. Whereas the growth of the net national product at constant prices is an index of the total productive effort on the part of the community and indicates the rate of growth of goods and services in the economy. The growth of per capita income at constant prices is an indicator of the change in the standard of living of the people.
Plan – wise study of growth of real income in India, however, does indicate an encourag-ing fact that although the annual rate of increase in national income was pretty low at 3.5 percent pere annum during the first three decades of economic planning, it has risen to 5.9 per cent per annum since 1980-81. The description of the national income trends during the past seven decades clearly highlights the main features of growth in this country. They are erratic growth, growth rate at best being modest, post-1991 reform growth being less fragile.
From the time India switched ovedr to economic planning, the net national product has continued to grow, despite erratic growth in agricultural produtin and shortfalls in the industrial output. There is no doubt that this is an encouraging development in an economy, which had suffered long spells of stagnation under the British. However, assessment of the performance of an economy can more accurately be made by examing the trends in per capita national income which is the same thing as per capita net national product at factor cost.
The data given in Table shows that during the 68 years (1950-51 to 2017-18), the Net National Income increased from Rs, 2,69,724 crore to Rs. 1,14,04,413 crore at coinstant prices, whereas at current prices the net national income increased from Rs. 9,829 crores to Rs. 1,47,10,563 crore in the same period. The per capita income also increased from 7,513 in 1950-51 to Rs/ 86,668 in 2017-18 at consan price. Even a current prices. It increased form Rs. 274. Rs. 274 to Rs. 1,12,835 in the same period. It can be said there is an increasing trend both in NNP and per capita NNP since the inception of planning.
Net National Income at Factor Cost and Per capita NNI
The growth rates of national income and per capita income are presented in Table. During the 30 – year period (1950-51) to 1980-81), the annual rae of growth of national income (1999-2000=100) was of the order of 3.5 per cent and that of per capita income was merely 1.4 percent. Calcualted at current prices, the annual rate of growth of net national product was of the order of 9.0 percent and that of per capita income was 6.7 percent.
Growth Rates Of National Income and Percapita Income (Percent)
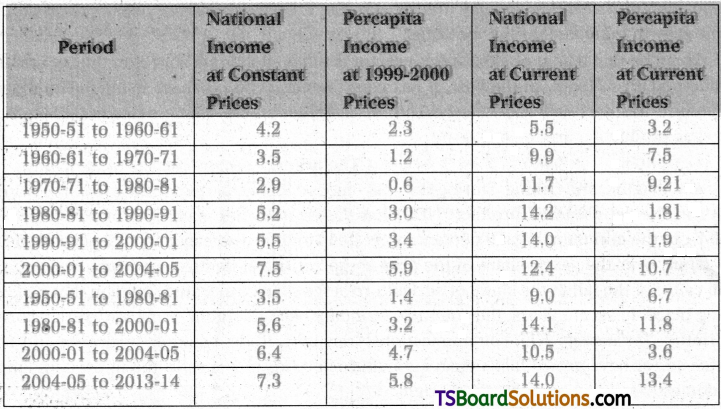
During the first 10 years of planning (1950-51 to 1960-61), net national product increased at an annual rate of 4.2 percent and the performance of the economy declined thereafter. During 1960-61 and 1970-71, the rate of growth of NNP came down to 3.5 per cent and that per capita NNP to 1.2 per cent per annum. In the subsequent 10-year period (1970-71 to 9 1980-81), the rate of growth of NNP was 2.9 per cent and that of per capita NNP slumped down to 0.6 pet cent per annum.
There was a very perceptible improvement in growth rate during the eighties. During 1980-81 and 1990-91, net national product showed a growth rate of 5.2 per cent per annum and the per capita NNP (at 1999 – 2000 prices) improved on an average by 3.0 per cent per annum. This Hindu rate of growth, to use the phrase of late Prof. Raj Krishna. During 1990-91 to 2000 – the order of 5.5 percent per annum and that of NNP per capita was 3.4 percent. During the two decades (1980 – 81 and 2000 – 01), the average annual growth of NNP was 5.6 percent and tght of per capita NNP was 3.2 percent. It implies that the economy has performed better during these two decades as compared with the earlier three decades.
During 2000-01 and 2004-05, NNP growth rate accelerated to 6.4 per cent and per capita NNP grew at the rate of 4.7 per cent per annum (at 1999-2000 prixces). During 2004-05 and 2013-14 we find further acceleration in the NNP growth rate to 7.3 percent and that of per capita income to 5.8 percent (at 2004-05 oruces). This implies a further acceleration in the growth of national income at a higher level. This is a very healthy development.
![]()
Question 2.
Briefly examine the sectoral contributions to the National Income.
Answer:
National income is the value of all final goods and services produced in a year in a country. This concept is used as an indicator of economic development of a country.
Sectoral Contribution of National Income :
The study of national product by the sectoral contribution explains the anatomy of the economic structure. The analysis of sectoral contribution is equally important as of the trends in national income. The structural change in the composition of national income by industrial origin is the consequence of the process of eco-nomic growth initaiated during the plans.
It can be said that at present service sector is the predominant source of the net domestic product (NDP) in India. In the past, it has contributed about 1/3 share to NDP. The share of agriculture has declined enormously. The broad trends in the changing composition of the domestic production are the following :
1. Contribution of the Primary Sector :
The primary sector consists of agriculture, for-estry and logging, and fishing. During the post – independence period, the share of the primary sector in the net domestic product (NDP) has varied from the maximum of 57.2 percent in 1950-51 to the minimum of 13.9 percent in 2013 -14 and the increased to 16.1 percent in 2018 – 19, Thus, over the years, share of the, primary sector in net domestic product declined. The main cause of the fall in the share of agriculture is the structural transformation that had been taking place. In recent years, the country’s economy has undergone some structural changes. Informtion Technology (IT), communications, transport, trade, banking, insurance and other service sector have grown faster than agriculture and this fact is reflected in the estimates of net domestic product by industry of origin.
2. Contribution of the Secondary Sector :
The secondary sector comprises pf, miningn and quarrying, manufacturing, construction, electricity, gas and water supply has shown a steady increase from 15 percent in 1950-51 to 23 percent in 1980-81 and 29.6 percent in 2018-19.
3. Contribution of Tertiary Sector :
The share of tertiary sector which includes IT, trade, transport, storage, communications, banking insurance, real estate, communituy and personal services had improved from 25 percent in 1950-51 to about 54.3 percent in 2018-19. This can be attributed to the share of trade, transport and communications. The expansion of transport, especially road transport, IT and communications was the major contributor to this increase.
By and large, from the aforesaid analysis, it can be surmised that ther is a sudden jump of the Indian economy to pass on to the stage of a post-industrial service economy without com-pleting the phase of industrialization. The changing structure of national income needs to be further stmgthened by stepping up the programme of industrializaion. This does not imply a neglect of agricultue, industrialization of the economy with emphasis on agro-based industries and industries supplying inputs to agriculture is a sine-qua-non for a faster growth of the economy.
Question 3.
Discuss the growth rates of national income and percapita income during the five year plans.
Answer:
Annual growth rates of national income and percapita income during the plans have been presented in the following Table. During the First Plan, annual average growth rate of NNP was 4.4 percent (at 1999-2000 prices), which declined to 3.8 percent during the Second Plan. However, during the third plan, annual average increase in antional income slumped down to 2.6 per cent which was just sufficient to neutralize the growth of population. This is indicated by the fact that there was 0.4 percent of growth of per capia income during the Third plan.
This was largely the consequence of a serious drought in 1965-66 and thus the growth rate got depressed. This was followed by another drought year as also a business recession. After 1967-68 the economy started picking up and the growth rae showed signs of improvement. During the Fourth Plan (19679-74) period, the average annual rate of growth of national income declined to 3.1 percent and that of real per capita income to 0.8 percent per annum. The sharp increase in prices during 1972 – 73 and 1973 – 74 and the shortfalls in production on account of lower utilisation of capacity were the principal factors responsible for a lower growth rate during the Fourth Plan.
Annual Growth Rates in Various Plans
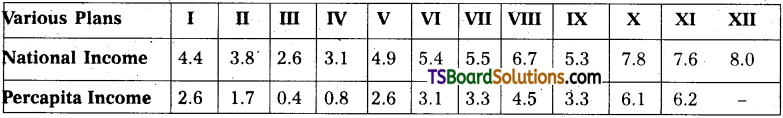
During the Fifth Plan (1974-79) the average annual increase in national income was of the order of 4.9 percent and that of per capita income was 2.6 percent. On the whole, the performance of the economy during the Fifth Plan can be considered very satisfactory. India’s national income registered a growth rate of 5.4 percent during the Sixth Plan (1980 – 85) wutg a oer caouta ubcine growth rate of 3.1 percent. During the Seventh Plan (1985 – 90), India’s NNP grew on the average at the rate of 5.5 percent per annum and the annual growth of per capita NNP was 3.3 per cent, Obviously, Seventh Plan achieved its objective of 5 percent growth rate of NNP along with 3 per cent targeted growth rae of per capita NNP.
During the Eighth Plan (1992 – 97) NNP growth rate of order of 6.7 percent has been achieved with a per capita growth of about 4.5 per cent. This healthy trend needs to be sustained. During the Ninth plan (1997 – 2002), NNP growth was 5.3 per cent with a per capita growth of about 3.3 per cent. During the Tenth Plan (2002 – 07), NNP growth was 7.8 percent-the highest recorded so far, During Eleventh Plan, rate of grwoth of NNP remained 7.6 percent and 6.2 percent in per capita NNP. During twelfth plan, rate of growth of NNP was 8 percent.
On viewing the performance of the economy between 1950 – 51 and 2012 -13 in the light of the goal set out in the First and Second Plans, it turns out to be desappointing. The rate of increase in per capita net national product has not only remained low but despite six decades of economic planning, is still unsteady and erratic. There were years of spurts in per capita net national product, but there were also some years in which it either declined or remained con-stant. Further, years of spurts in per capita net naional product were the same in which agricuF tural production had increased significantly, and the periods in which per capita net national product had either declined or fluctuated around the level achieved in the preceding year were, not different from those marked by bad weather resulting in crop failures.
![]()
Question 4.
How do you reduce inequalities in distribution of income and wealth.
Answer:
Unequal distribution of income and wealth in the economy among the people is knowii as Income and wealth inequalities. ‘
Remedial measured to reduce income and wealth inequalities : Reducing Income In-equalities :
1) Land Reforms and Redistribution of Agricultural Land :
It is a well – known fact that income inequalities in the rural sector emanate mainly from the concentration of agricultural land. Before the abolition of the zamindari system most of the land belonged to the absentee landlords who appropriated a large portion of the agricultural production while the tiller of the soil got hardly enough for subsistence. Thus, legislative measures were undertaken to abolish landlords and other intermediaries and ceilings on holdings were fixed. As a consequence, even now about 40 percent of the agricultural land belongs to top 5 percent of the rural house holds.
2) Control over Monopolies and Restrictive Trade Practices :
Control of monopoly tendencies is considered necessary of reducing income inequalities. The Monopolies and Re-strictive Trade Practices Act (MRTPA) was passed at late as 1969. Now with the increasing stress on liberalisation in the industrial sector.
3) Employment and wage policies :
Until the fourth five year plan, the employment objective was not taken seriously. However, since the beginning of the fourth plan some special programmes were undertaken such as the crash scheme for rural employment etc. These programmes were shortlived as they were undertaken in an adhoc manner The IRDP and allied programmes such as Training of Rural Youth for Self – Employment (TRYSEM) and Development of Women and Children in Rural Areas (DWACRA) have been restructured into a single self – employment programme called Swamajayanti Gram Swarozgar Yojapa (SGSY) from April 1999. This is the most ambitious scheme introduced in the post – independence period to alleviate poverty.
4) Social Security Measures :
Although the country does not have a comprehensive social security system, yet there are some social security provisions which are expected to help the workers in the organised sector. The most comprehensive social security measure, however, is the employees state insurance act which entitles the insured workers to medical benefits, disability benefits for the: period of sickness, maternity benefit and benefits to dependents.
5) Minimum Needs Programme :
Since the beginning of the 1970s a very influential section of development economists has started asking for the pursuit of the minimum needs programme in developing countries. Since the sixth five year plan, the government has been providing free or subsidised services through public agencies which are expected to improve the consumption levels of those living below the poverty line and thereby improve the productive efficiency of both the rural and urban workers.
6) Programmes for the uplift of the rural poor :
The hardcore of the poverty is to be found in the rural areas. The poorest sections in the rural areas belong to the families of landless agricultural labourers, small and marginal farmers, rural artisans, scheduled castes and scheduledtribes.
7) Taxation :
The taxation structure and the degree of progression in the rates of direct tastes one gets the impression that the Indian tax system is progressive and has been designed to prevent concentration of wealth in a few hands.
Question 5.
Explain the incidence of unemployent in India.
Answer:
Unemployment refers to the people those who are willing and able to work at the existing market wage rate are unable to find emloyment.
Unemployment in developing countries is both open and disguised. Like all other devel-oping countries, India presently suffers mainly form structural unemployment which exists in open and disguised forms. During the 1951-2011 period, population in this country increased at an alarming rate of around 2.1 per cent per annum and with it the numer of people coming to the labour market in search of jobs also rose rapidly, whereas employment opportunities did not increase most of the time correspondingly due to slow economic growth. Hence, there has been “an increase in the volume of unemployment from one plan period to another.” This un-employment, on account of its very nature, can be eliminaed only by introducing certain radical reforms in the structure of the economy.
Although the reforms were introduced in 1991, yet the year 1991 – 92 was particularly a depresed year and the reform process really got a going by 1993 – 94. Thus, 1993 – %4 to 2004 – 2005 – the 11 – year period can be considered as the period of liberalisation. It may be noted that all categories of unemployment showed a declining trend during the period 1977 – 78 to.1993 – 94, but the trend got reve rsed during 1993 – 94 and 2004 – 05.
Unemployment as measured by UPS criterion declined from 4.23 percent in 1977 – 78 to 2.56 percent in 1993 – 94, but indicated an increase to 3.06 percent in 2004 – 05, In 2011 – 12, unemployment on UPS criterion was estimated to be 2.7 percent. Even the most comprehensive measure of unemployment, viz., current daily status (CDS) unemployment rate declined from 8.18 percent in 1977 – 78 to 6.03 percent in 1993-94, but the declining trend was reversed and unemployment increased to 8.28 percent in 2004 – 05. In 20\11 – 12, rate of unemployment on same situation can be observed with respect to both urban, arid rural areas. However, it may be noted that whereas CDS rate for urban areas increased very slightly from 7.43 percent in 1993-94 to 8.28 per cent in 2004 – 05.
Though we notice a declline in unemployment rates in 66th Round of NSSO, it does not seem to be any deviation-front the earlier trend. This is so because between 2004 – 2005 and 2009 – 10 we find addition to labour force to be only 9.2 million which is much less than the earlier period. The same phenomenon could be observed in all measures of unemployment both in the rural and urban areas. This underlines the relative neglect of the rural economy in the first phase of economic reforms. Usual Principal Status (UPS) measures open unemployment throughout the year, but current daily status (CDS) besides taking into account open unemployment also measures under – employment. From the data it becomes obvious that whereas the UPS rates are modest, the CDS rates are quite high.
As against unemployment rate of 10.34 per cent in 1977 – 78 in urban areas, the rural unemployment rate 7.70 percent. There was a significant fall in therural unemployment rate, in 1987 – 88 to 5.3 per cent, but the urban unemployment rate was jof the order of 9.4 per cent, signigicatly higher. After 1993 – 94, in the period of liberalisation rural lunemployment rate again increased to 8.28 percent, signigicantly higher. After 1993 – 94, itn the period of liberalisation increased to 8.28 per cent during 1993 – 94 to 2004 – 05. High levols of unemployment in the urban areas could be explained by a larger proportion of organized s ector unemployment which forces people to either remain employed or unemployed, since the chances for getting engaged in low productive activities are relatively fewer.
As against this, the; rural areas indicat higher levels of disguised unemployment. Gradual and continuous decline of urban unemployment rates till 1993 – 94 and even a very Marginal increase in 2004 – 05 may be due’ to greater attention being given to urban areas in the development process, but (the increase in unemployment rates in rural areas may be due to the neglect of rural area in the post-reform period It may be also be due to a shift in the composition of employment from self – employment casual labour.
It can be said that in the usual status (PS + SS), unemployment rates were 5.8 percent among males and 3.8 percent among females in rural areas, while t he rates were 7.1 percent among males and 10.8 percent among females in urban areas. In the case of current wekly status, the unemployment rates were 8.8 percent among males and 7.7 percent among females in rural areas while the rates were 8.8 per cent among males and 7.7 percent among females and 12.8 per cent among females in urban areas.
![]()
Question 6.
Explain the remedial measures of poverty and unemployment in India.
Answer:
Remedial Measures of Poverty & Unemployment – Government Initiatives : Since poverty and unemployment are inseparable, the policy measures for reducing unemployment are equally applicable for the removal of poverty. In 1950s and 1960s Indian planners believed in the trickle – down theory. Accoriding to this view, poverty alleviation was a gradual and automatic process as the economy grew. Accordingly, employment generation was accepted as a goal of development planning. However, a faster growth with special emphasis on employ-ment-intensive sectors like the small – scale industry was considered adequate to generate, employment of the order required to take care of the problem.
Following the publication of the Bhagwati Committee report in 1973, the Government took various measures to provide em-ployment and alleviate under-employment. Unfortunately, the trickle – down theory failed to eradicate poverty and unemployment rather poverty and unemployment increased over the years. This led the planners to adopt four board categories of programmes in stages for poverty alleviatiqn.
- Resources and income development programmes for the rural poor.
- Special ara development programmes.
- Work programmes for the creation of supplementary employment opportunities and
- The minimum needs programme to improve the consumption levels’of the poor in order to raise their productive efficiency.
1. Resource and Income Development Programmes :
A number of programmes have been in operation in the country since 1970, and some are introduced recently. They aim at improving the economic conditions of the rural poor and to increase their income. Special programmes in this category such as Small Farmers and Development Agency (SFDA), Marginal Farmers and Agricultural Labour Agency (MFAL), Integrated Rural Development Programme (IRDP) etc. were introduced to develop the resources and incomes of the rural poor.
2. Special Area Development Programmes :
In this category are included such programmes as Drought Prone Area Programme (DPAP), Desert Development Programme (DDP), Hill Development Programme were aimed at developing areas with specific purposes, forestry, dairy development to raise the inicomes of the weaker sections of those areas.
3. Programmes for Creating Supplementary Employment:
The third category includes Employment Generation or National Rural Employment Generation Programmes such as National Rural Employment Programme (NREP) Rural Landless Employment Guarantee Programme and the Food for Work Programme (FWP), Prime Minister Inrtegrated Urban Poverty Eradication Programme (PMIUPEP) which am at creating supplementary employment to the poor. The NREP is rechristened as MGNREGP (Mahatma Gandhi National Rural Employment Generation Programme).
4. Mininum Needs Programmes :
The fourth category includes minimum needs programme, 20 poing programme which aim at improving the xonsumption levels of te poorer sections in order to raise their productive eficiency. This includes the elementary education, helath, water supply, roads, electrification, housing, and nutrition to both rural urban poor.
In recent years, a two pronged strategy was introduced by the government towards a solution to the problem of poverty in India viz;
a) the expansion of sectors which promise higher labour abosorption; and
b) empowering the poor with education, skill formation and health so that they can enter into the sectors which require higher competence and provide better remuneration which enable the poor to cross the poverty line.
Amartya Sen’s entitlement approach emphasises the above aspects. Various strategies have been utilized at the central and state leel to eradicate poverty. Some of the important strategies have been mentioned to indicate how the state countered the severity of existence of povrty in the country. They are:
- Adoption of a strategy of pro-poor growth instead ofemphasizing liberalisation and GDP growth,
- Stimulating agricultural growth,
- Increasing ghe productivity and job quality of the un-organised sector,
- improving the share of wages in the process of growth to achieve poverty reduction,
- Empowerment of the poor through education and skill formation,
- Empowerment through provision of better health facilities,
- Empowering the poor through provision of housing.
- Empowerment through skill formation for expanding IT sector, and
- Progjding employment through MGNREGP
Question 7.
Write a note on views of Abhijit Banerjee on poverty.
Answer:
Abhijit Vinayak Banerjee :
(Bom February 21,1961, Mumbai, India, Indian – born Am erican economist who, with Esther Duflo and Michael Kremer, was awarded the 2019 Nobel Pirize for Economics for helping to develop an innovative experimental approach to alleviate global poverty. Banerjee is a professor in Massachusetts Institue of Technology (MIT).
Banerjee, Duflo, and Kremer applied their experimental approach in many areas, includ-ing education, health and medicine, acces to credit and the adoption of new technologies to find the real causes behind poverty.
According to Benerji and Duflo, extremely poor are underfed and weak % and earn bairely enough to cover their basic needs which they always try to fulfill in the least expensive way. Historically, poverty lines in many countries were originally set to capture exactly. This definition of poverty at the budget needed to buy a certain amount of calories, plus some other indispensable purchases. A “poor” person was by definition someone without enough to eat.
1) Among productive assets, land is the one that many people in the rural surveys seem to own though there are enormous country-to-country variation. Apart from land, ex-tremely poor households in rural areas tend to own very little by way of durable goods, including productive assets.
2) The extremely poor spend very little on education. The expenditure on education gen-erally hovers around 2 percent of household budgets. The reason for spending low is that children in poor households typically attend public schools or other schools that do not charge a fee. In countries where poor households spend more on education, it is typically because government schools have fees.
3) Many poor households have multiple occupations. For instance, a person actually has more than one occupation like both a business and a labour’s job. This multiplicity of occupations in urban areas is found in many other countries as well, though not every-where. This pattern Of multiple occupations is stronger in rural areas.
4) Poor families do seek out economic opportunities, but they tend not to get too specialized. This lack of specialization has its costs. Many of these poor households receive most of their earnings from these outside jobs, despite only being away for 18 weeks of the year on average. As short – term migrants, they have little chance of learning their jobs better or ending up iin a job that suits their specific talents or being promoted. Even the non – agricultural businesses that the poor operate typically require relatively little specific skills.
5) The availability of physical infrastructure to the poor like electricity, tap water, and ‘ even basic sanitation varies enormously across countries. Some governments provide reasonable access to both electricity and tap water to the extremely poor. Generally, access to electricity and tap water is greater for the urban poor than the rural poor.
6) In most low-income countries, there has been some attempt to make sure that poor households have access to primary schools and basic health centers. For example, most Indian villages now have a school within a kilometer, and there is a health subcenter for every 10,000 people. However, the quality of the facilities that serve the poor tends to be low, even when they are available, and it is not clear how much they actually deliver.
The low quality of teaching in public schools has clear effect on learning levels as well. In India, despite the fact that 93.4 per cent of children aged between 6- 4 are enrolled in schools a recent nationwide survey found that 34.9 per cent of the children aged between 7-14 cannnot read a simple paragraph at second – grade level. Mvoeover, 41.1 percent cannot do subtraction, and 65.5 percent cannot do division. Even among children in grades 6 to 8 in government schools, 22 percent cannot read a second – grade text.
Short Answer Questions
Question 1.
Bring out the share of public and private sectors in GDP of India.
Answer:
The activities of the public sector were restricted to a limited field like irrigation, power, railways, communications and some departmental undertakings. After independence, the area of activities of the public sector expanded at a very rapid speed.
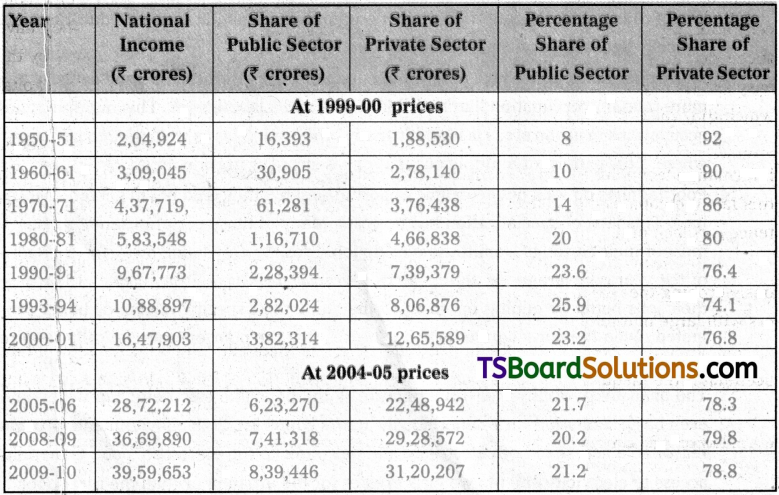
National income is produced in public sector as well as in private sector. Prior to 1951, the share of public sector was very small. With the introduction of five year plans there was; a gradual increase in the economic activities of the state. As a result, the share of public sector in national income has gradually increased.
The public sector accounted for 8 percent of the GDP in 1950-51, is share in 2000-01 had risen to 23.2 percent. However, it declined to 21.7 percent in 2005-06 and further to 20.2 per-cent in 2008-09 and again there is a slight increase to 21.2 percent in 2009-10. Thus, the publtic sector accounts about one – fifth of the national income. Though, this is largely due to a rapid expansion of the public sector enterprises, the private sector still occupies a dominant position in the economy.
After the introduction of economic reforms, the share of private sector in the national income increased to 76.8 percent in 2000-01, 79.8 percent in 2008-09 and reduce marginally to 78.8 percent in 2009-10.
![]()
Question 2.
Examine the causes for inequalities in the distribution of income and wealth.
Answer:
1) Inequalities in land ownership :
There was concentration of landed property in India during the British period on account of the zamindary system. The Zamindary system was; abolished immediately after independence, yet the concentration of land ownership could not be broken.
2) Concentration of Assets in the private corporate sector :
There is an extreme con -centration of economic wealth and power in the hands of large industrialists and they have succeeded in acquiring massive assets over time. They have been aided in their efforts by the; easy availability of finance from banks and other financial institutions, besides equity capital which they raise from the market.
3) Inequalities in Professional Training :
Incomes of business executives, engineers, information technologists, physicians, lawyers and other professionals are often high and from this fact it emanates the false notion that income inequalities arise from professional competence (or) lack of it.
4) Inflation and the price rise :
Since the mid – 1950s, prices have been rising continuously eroding the real income of the working class, while the industrialists, traders, and farmers with large marketable surplus have benefited a great deal from this inflationary process.
5) Inequity in credit facilities :
In India, there is inequality in credit facilities which acentuates the inequalities arising from an unequal distribution of wealth. Business firms and individuals having an access to the formal capital markets manage to obtain finance on very favourable terms, while vast mass of small and marginal farmers, agricultural labourers and artisans depend heavily on money lenders who charge an exorbitant rate of interest and also exploit these poor people in a number of ways.
6) Urban Bias in Private Investment :
While 70 percent of the population in this country lives in rural areas, about 70 percent of private investment goes to industries in urban areas. Therefore, there is a distinct urban bias in the pattern of private investment. This urban bias tsikes the form of highly mechanised projects in which the share of wages in value added is relatively low. This naturally leads to inequality in income distribution.
7) The Role of the Government :
Though the state is often proclaimed as a precursor and initiator of economic change in India, the fact is that the state investment essentially plays a supportive rote to private investment (especially the large and capital intensive enterprises). This is due to fact that the state depends for its support on the same social forces which own the wealth of the country and supply the technicians, administratory and the dominant political groups.
Question 3.
Examine the different types of unemployment.
Answer:
unemployment is a situation where the persons those who are willing and able to work at the current wage rate are unable to get work.
Types of unemployment :
1) Structural Unemployment :
This type of unemployment is associated with economic structure of the country. When demand for labour falls short to the supply of labour due to rapidly growing population and their immobility, the problem of unemployment appears in the , economy. Rate of capital formation which again limits the employment opportunities. This type of structural unemployment is of long run nature.
2) Under – Employment :
Those labourers are under – employed who obtain work but their efficiency and capability are not utilized at their optimum and as a result they contribute in the production upto a limited level. A country having this type of unemployment fails to exploit the efficiencies of their labourers.
3) Disguised Unemployment :
A person does not contribute anything in the production process if can be removed from the work without affecting the productivity adversely, he will be treated as disguisedly unemployed. The marginal productivity of such unemployed person is zero. Agriculture sector of under developed / developing economies possesses this type of unemployment on a large scale.
4) Open Unemployment :
when the labourers live without any work and they don’t find any work to do, they come under the category of open unemployment. Educated unemployment and unskilled labour unemployment are included in open unemployment. The migration from rural to urban areas in search of work is very often found in India which is an example of open unemployment.
5) Educated Unemployment :
Even when a person who is educated / trained and skilled fails to obtain a job suited to his qualifications, he is said to be educated unemployed. Presently this type of unemployment has become a problem for developing economies, particularly for India.
6) Frictional Unemployment :
The temporary unemployment which exists during the period of transfer of labour from one occupation to another is called frictional unemployment. It arises due to the imperfections of labour market. Imperfections in labour market are reflected in the ignorance of labour about job opportunities.
7) Seasonal unemployment :
It appears due to a change in demand based on seasonal variations. Labour do not get work round the year. They get employment only in some seasons in the year. Indian agriculture ensures employment for only 7-8 months and labourers remain unemployed in the remaining period. This temporary type of. employment gives birth to seasonal unemployment.
8) Cyclical unemployment :
The main cause of it is the slackness in business activities. This type of unemployment is generally witnessed in the developed countries.
9) Technological Unemployment :
When the introduction of new technology causes displacement of workers, it is called technological unemployment.
10) Non employment :
The people who are working in their household activities or unorganised sector in developing countries are treated as non – employment category persons.
Question 4.
Analyse the causes for unemployment in India.
Answer:
Causfis of Unemployment :
The foregoing analysis of enemployment in India has made it evidently clear that most of the unemployment in this country is structural. Some of the main causes ae mentioned hereunder:
Some of the main causes of unemployment are mentioned here under :
1) Jobless Growth :
During, the first decades of economic planning, the GDP growth rate was as low as 3.5 percent per annum. In this period, employment increased at a reasonable rate of 2 percent per annum. However, thereafter, while the GDP growth rate picked up considerably, employment growth rate registered a sharp fall. Infact, while employment growth was as high as 2.82 percent per annum over the five year period 1972-73 to 1977-78, it fell to only 1.02 percent per annum over the five year period 1993-94 to 1999-2000. The country witnessed a phenomenon of jobless growth in the period of 1990s.
2) Increase in Labour force :
Since independence, death rate has rapidly declined and the country has entered the second stage of demographic transition. The rate of population growth rose to 2.2 percent per annum during the 1960s, and as a consequence, rate of increase in labour force also rose to 1.9 percent per annum. During the period 1983 to 1993 – 94 both demographic and social factors further raised the rate of growth of labour force.
3) Inappropriate Technology :
In India, while capital is a scarce factor, labour is available in abundant quantity. Under these circumstances, if market forces operate freely and efficiently, the country would have labour – intensive techniques of production, However, not only in industries, but also in agriculture, producers are increasingly substituting capital for labour.
4) Inappropriate Educational System :
The Educational system in India is defective. It is in fact, the same educational system which Macaulay had introduced in this country during the colonial period. To Gunnar Myrdal, India’s educational policy does not aim at development of human resources. It merely produces clerks and lower cadre executives for government and private concerns. With the expansion in the number of institutions which impart this kind of education, increase unemployment is inevitable
5) Neo – Liberal Economic Policy :
With the introduction of neo-liberal structural reforms in India since the early 1990s, income inequalities have increased. Growing income inequalities generally lead to demand constraint recession and unemployment.
Consequences of Unemployment :
1) Loss of Human Resources :
The problem of unemployment causes loss of human resources. Labourers waste their maximum time in search of employment.
2) Increase in poverty :
Unemployment deprives a man of all sources of income. As a result he grows poor. Therefore, unemployment generates poverty
3) Social Problems :
Unemployment breeds many social problems and social security is jeopardized.
4) Political Instability :
Unemployment gives birth to political instability in a country. Unemployed persons can easily be enticed by anti social elements. They lose all faith in democratic values and peaceful means.
5) Exploitation of labour :
In the state of unemployment, labourers are exploited to the maximum possible extent. Those labourers who get work have to work under diverse conditions of low wages. All this tells upon efficiency of labourers.
6) Standard of living :
In times of unemployment, the competition of jobs and regotiation power of individual decreases and thus also the living standard of people with the salaries, packages and income reduced.
7) Employment Gaps :
To further complicate the situation, the longer the individual is out of job the more difficult it becomes of find one. Employers find employment gaps as negative aspect. No one wants to hire a person who has been out of work for some time even when there’s no fault of the individual persons.
8) Lose of skill’s usage :
The unemployed is not able to put his / her skills to use. And in a situation where it goes on for too long the person may have to lose some of his / her skills.
![]()
Question 5.
Explain the consequences of the problem of unemployment.
Answer:
Causes of Unemployment: The widespread unemployment in urban as well as in rural India is a complex problem caused by many factors. Unemployment affects not just the person himself but also his / her family apd in the long-run the society where he lives. Unemployment brings with it despair, unhappinelss and anguish. The major consequences of the problem of unemployment are as follows :
Consequences of Unemployment :
1) Loss of Human Resources :
The problem of unemployment causes loss of human resources. Labourers waste their maximum time in search of employment.
2) Increase in poverty :
Unemployment deprives a man of all sources of income. As a result he grows poor. Therefore, unemployment generates poverty
3) Social Problems :
Unemployment breeds many social problems and social security is jeopardized.
4) Political Instability :
Unemployment gives birth to political instability in a country. Unemployed persons can easily be enticed by anti social elements. They lose all faith in democratic values and peaceful means.
5) Exploitation of labour :
In the state of unemployment, labourers are exploited to the maximum possible extent. Those labourers who get work have to work under diverse conditions of low wages. All this tells upon efficiency of labourers.
6) Standard of living :
In times of unemployment, the competition of jobs and regotiation power of individual decreases.and thus also the living standard of people with the salaries, packages and income reduced.
7) Employment Gaps :
To further complicate the situation, the longer the individual is out of job the more difficult it becomes of find one. Employers find employment gaps as negative aspect. No one wants to hire a person who has been out of work for some time even when there’s no fault of the individual persons,
8) Lose of skill’s usage :
The unemployed is not able to put his / her skills to use. And in a situation where it goes on for too long the person may have to lose some of his / her skills.
Question 6.
Examine the causes for poverty in India.
Answer:
Poverty can be defined as a social phenomenon in which a section of the society is unable to fulfill even its basic necessities of life.
Causes for poverty :
The causes for poverty in India are as follows.
1) Concentration of Economic Power :
In India, the income gap has a significant urban – rural bias and these income differences have increased over the 1990’s. Consequently, the phenomenon observed in the Indian economy is : It has started growing, the rich are reaping the benefits of development. Thus, inequalities in income and wealth, concentration of economic power were the reasons for the rich becoming richer and poor becoming poorer.
2) Under – Exploitation of Natural Resources :
To improve the standard of living of the people in the country, it is essential that we should achieve higher rate of growth in national income. To increase the national income, the natural resources in the country must be fully and profitably exploited. In our country there is under – exploitation of natural resources. Therefore, inspite of 60 years of planning experience, still 19.3 pejrcent of the population live below the poverty line.
3) Heavy population pressure :
The main problem jin India is the high level of birth rates coupled with a falling level of death rates. The averageannual growth rate of population from 1951-2001 was 2.1 percent. The fast rate of growth of population necessitates a higher rate of economic growth in order to maintain the same standard of living of the population. To maintain a rapidly growing population, the requirements of food, clothing, shelter, medicine etc. rise. A high growth rate of population and low growth! rate of national income will bring down the percapita income, which means the percapita expenditure will also come down.
4) Unemployment :
In India, labour is an abundant, factor and consequently, it is very difficult to provide gainful employment to the entire working population. Unemployment is structural and results in deficiency of capital. This result in the unemployment and poverty in the country. With an increase in the number of unemployed persons, the incidence of poverty also increase.
5) Poor Education :
Another major cause of poverty is the low educational attainments of the poor. These educational differentials are one of the main factors for relatively lower levels of income among the poor. The earnings of arts, science, commerce graduates were nearly six times as compared with those of illiterates and 3.5 times as compared with those with primary level education.
6) Low consumption of Essentials :
Another important cause of the poverty in India is the low availability of essential commodities. The consumer goods shortage is responsible, for low level of standard of living. There is a wide disparity in the consumption levels of the top rich and the bottom poor.
7) Inflation :
Rising prices are another cause of poverty. When prices rise, the purchaging power of money falls and it leads to impoverishment of the lower middle and poorer sections of the society. Thus, the inflationary pressures further increase the poverty in the country.
8) Low Technology :
Low level of technology is also responsible for the poverty in India. Not only in manufacturing processes and agricultural production, techniques are far below the developed economies, but even making skills, the capacity to organize production units, and financial markets are low level. As a result of low technology, percapita productivity remains at a low level.
9) Capital Deficiency :
The development of the economy depends on capital information in the country. In India most of the poeple are illiterate and unskilled. They used outmoded capital equipment as methods of production. They practice subsistence farming, lack mobility and have little connections with the market sector of the economy.
10) Failure of five year plans :
The basic objective of planning is the provision of a national minimum of level of living. The garibi hatao (remove poverty) slogan of Mrs. Indira Gandhi could be provided a meaningful content only if measures were taken to remove poverty. The fact that even after 5 decades of planning, 19.3%. of population is living under the conditions of poverty is a sad commentary on our planning.
11) Liberalisation, privatisation and Globalisation model of development :
This model by passes agriculture and agro-based industries which are a major source of generation of employment for the masses. This strategy has less trickle -down effect on the economy, there fore, poverty may increase in the country.
12) Social Factors :
In India, people are caught in the vicious circle of the poverty due to the prevalent socio – cultural institutions. In order to fulfill social obligations and observe religious ceremonies form cradle to grave, people spend extravagantly. Besides, illiteracy, igarance, religious ideas, casteism and joint family system prevented people from adopting modem ideas and techniques where by they could increase their income and reduce poverty.
![]()
Question 7.
Discuss the consequences of the problem of poverty.
Answer:
When a substantial segment of a society is deprived of minimum level of living and con-tinues at a base subsistence level, that society is said to be plagued with mass poverty.
consequences of the problem of poverty : The adverse effects of the problem of poverty are mentioned here under.
1. Unequal opportunities :
Generally, haves avail all better opportunities with the aid of money arid supremacy of resources while the poor class always remained deprived off even the basic needs. Consequently, the poor are more severely effected.
2. Concentration of Economic Power :
Another far – reaching consequence of poverty is that it leads to the concentration of economic power in a few pockets. The rich people make use of their economic powers to attain the political power.
3. Inefficiency :
Due to the prevalence of the poverty. The poor do not get opportunities of education and other specialized training. Without proper understanding and skill, there is overall inefficiency in the production process.
4. Problem of Unemployment :
The problem of poverty leads to the problem of unem-ployment in the country as the poor do not have many opportunities to employment. A high unemployment rate can impede a country from progressing in all aspects.
5. Income Inequalities and Insecurity :
The problem of poverty leads to the growth of income inequalities. Ftirther, it creates the feeling of insecurity.
6. Society :
Poverty also has social effects. Many people living in poverty are homeless, which puts them on the streets. Homelessness and high crime rates impact a country’s people and can create many problems within a society.
7. Malnutrition :
The most common effect of poverty is malnutrition. This is especially seen in children of poor families. People living in poverty rarely have access to highly nutritions foods. Sometimes people in poverty are malnourished simply because they do not eat enough of anything.
8. Health :
One of the most severe effects of poverty is the health. This ranges from occurence of diseases to lesser life expectancy and a greater expenditure on medicine.
9. Education :
Education is largely affected by poverty. Many people living in poverty are unable to attend school from a very early age. Families may not be able to afford the necessary clothing or school supplies.
Question 8.
Bring out some of the poverty alleviation programes under taken by the government.
Answer:
Strategy of Poverty Alleviation and Employment Generation Programmes :
A careful examination of the poverty alleviation programmes reveals that the planners have made the assunption that the poor constitute a homogeneous category. The planners made no attempt to segment the group in terms of common characteristics and their requirements.
At present there seems to be littel integration in transfer to assets and skills approach and employment approach. It is suggested that in future there has to be greater coordination between these two elements of poverty alleviation programme. A major limitation of the existing poverty alleviation strategy is that it has no programmes for those households who neither have assets nor skills and in addition, do not have any able bodied adult memebr and thus cannot benefit from wage employment programmes. For such a category, separate policy measures would be required.- Obviously these destitutes are to be covered under social security schemes.
1) Under the Seventh Plan, the basic emphasis was on productive employment rather than the alleviation of poverty.
The programmes for poverty alleviation were viewed as supplementing the basic plan for overall growth. Therefore in the Seventh Plan poverty alleviation was not in focus. The planners claimed that the Seventh Plan policies were formulated after a careful analysis of lessons from performance of various poverty alleviation programmes. The Seventh Plan aimed at reducing the percentage of the population below the poverty line from 39.9 percent at the beginning of the Plan period to 28.2 percent by 1990.
2) Elimination of poverty was one of the major objectives of the Eighth Plan. The plan-ners had hoped to realise this objective by pursuing employment – oriented growth strategy. Hence, expansion of employment opportunities and augmentation of pro-ductivity and income levels of both the underemployed and unemployed poor were ade the principal instruments for achieving this goal during the Eighth Plan.
3) The Ninth Plan relied essentially on the trickle-down effects of economic growth for povrty alleviation. It nevertheless recognised the role of anti-poverty programmes.
4) The Tenth Five Year Plan sought to achieve a faster reduction in poverty rate by redressal of regional imbalances for which aggregate growth target was broken State-wise. Thus, the Tenth Plan also like the Ninth Plan relied on the tickle-down effect of economic growth for poverty alleviation.
5) The Eleventh Five Year Plan also emphasised rapid growth of the economy to achieve reduction an poverty. However, it emphasised that this growth must be better balanced to rapidly create jobs in the industrial and services sector.
6) The Twelfth Five Year Plan emphasises faster, sustainable and more inchlusive growth. According to the planners, while the objective of development is broad – based improvement in the economic and social conditions of our people, rapid growth of GDP is an essential requirement for achieving this objectie.
Two reasons are cited in support of this contention.
a) rapid growth of GDP produces a larger expansion in total income and production which, if the growth processes sufficiently inclusive, will directly raise living standards of a large section of the population by providing larger employment opportunities and other income enhancing activities.
b) rapid growth generates higher revenues which help to finance critical programmes of poverty alleviation and inclusiveness like Mahatma Gandhi National Rural Employ-ment Guarantee Scheme (MGNREGS). Sarva Shiksha Abhiyan (SSA), Mid – Day Meals (MDMs), integrated Child Development Services (ICDS), National Rural Health Mis-sion, (NRHM) etc.
Question 9.
Analyse the different concepts of poverty.
Answer:
Concept of Poverty :
Poverty can be defined as a social phenomenon in which a section of the society is unable to fulfill even its basic necessities of life. When a substantial segment of a society is deprived of minum level If living and continues at a bare subsistence level, that society is said to be plagued with mass poverty. The countries of the third world exhibit invariably the existence of mass poverty.
Types of Poverty
There are two types of poverty common in economic literature; the absolue poverty and the relative poverty. ,
1. Absolute Poverty :
In the absolute standard, minimum physical quantities of cereals, pulses, mik, butter etc are determined for a subsistence level and then the price quotations are converted into monetary terms for the physical quantities. Aggregating all the quantities in-cluded, a figure expressing percapita consumer expenditure is determined. The population whose level of income or expenditure is below the figure considered to be the absolute poverty.
2. Relative Poverty :
According to the relative standard, income distribution of the population in different fractile groups is estimated and a comparison of the levels of living of the top 5 to 10 percent with the bottom 5 to 10 percent of the population is called relative poverty, or It is the absolute poverty with which we are concerned when we talk of the problem of poverty in India. Advanced countrie such as the USA, UK, have succeeded in removing absolute poverty for their people, but relative poverty, prevails even in these countres because of uneven distribution of imcome.
3. The Poverty Gap Index :
The poverty gap index is defined by the mean distance below the poverty line expressed as a proportion of that line. The poverty gap .thus measures the transfer that would bring the income of every poor person exactly up to the povety line, therby eliminating the poverty. In this way the poverty gap relflects the depth of poverty, as well as is incidence, the povery gap index is claculated with the help of the following principle.

4. Human poverty Index :
Human Development Report 1997 introduced a Human Poverty Index (HPI) in an attempt to bring together in a comosite index the different features of deprivation in the quality of life to arrive at an agregate judgement on the extent of poverty in a community. Human Development Report 2010 introduced the concept of Mltidimensional Poverty Index (MPI) to replace HPI. The MPI is the product of the multidimensional poverty head – count and the average number of deprivations each multidimensionally poor household experiences. It has three dimensions mirroring the HDI – health, education and living standards-which are reflected in 10 indicators.
![]()
Question 10.
Briefly examine the incidence of poverty in India.
Answer:
Incidence of Poverty in India : The Planning Commission provided estimates of the incidence of poverty since the early 1970s. As stated earlier, it determined the poverty line for rural population at Rs. 49.63 per capita per month while for urban population, poverty line was fixed at Rs. 56.64 per capita per month. These poverty lines were updated over time keeping price changes in view.
Rangarajan panel suggested to the goernment that those spendig more than Rs. 972 a month in rural areas and Rs. 1,407 a month in urban areas in 2011-12 do not fall under the definition of poverty. Thus, for a family of five, the all-India poverty line in terms of consump-tion expenditure, as per the Rangarajan committee, would amount to Rs. 4,860 per month in rural areas and Rs. 7,035 per month in urban areas. If calculaed on a daily basis, this translates into a per capita expenditure of rs. 32 per day in ruaral areas and Rs. 47 in urban areas in 2011-12.
As per the Tendulkar methodology for 2011-12, the poverty line was Rs. 816 in rural areas and Rs. 1,000 in urban areas, which if calculated on a daily basis comes out at Rs. 27 per day in rural areas and Rs. 33 in urban areas. The Tendulkar Committee had pegged this at Rs. 4,080 and Rs. 5,000 respectively. Estimates for the years 1973-74, 1983-84, 1993-94 and 2011 – 12 are presented in the following Table along with poverty lines in these years.
Percentage of Population ISelow the Poverty Line
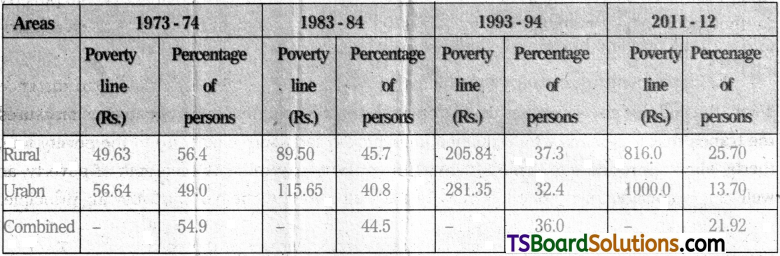
According to this table, more than half of the populatin was below the poverty line in 1973 – 74. Over the four decade period 1973-74 to 2011-12 there was a perceptible decline in the incidence of poverty – from 59.4 percent in 1973-74 to 21.92 percent in 2011 -12. However, in view of the fact that the populatin had increased considerably over the period, it can be safely concluded that the absolute number of poor people did not decline. This analysis is as per the data of Hand Book of statistics, RBI, Indian economy, 2018-19.
Very Short Answer Questions
Question 1.
National Income.
Answer:
The value of final goods and services produced in year in a country is known as national income. This concept is used as an indicator of economic development of a country.
Question 2.
Percepita income.
Answer:
If we divide National Income of a contry with countries population. We get per – capita – income. This can be explained as follows.
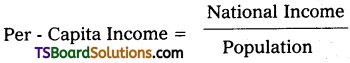
India’s per capita Income is Rs. 1,12,835 at current year prices.
Question 3.
Unemployment.
Answer:
Unemployment means when a labourer does not obtain employment opportunity despite his willingness to work on existing wage rate.
According to keynes unemployment in developed economics to be the result of an defi-ciency in effective demand, the nature of unemployment in developing countries like India is disguised unemployment in nature. These economies also face the problem of Inflation side by side with the problem of unemploymet.
Question 4.
Chromic under employment.
Answer:
This concept also known as usual principal status employment. It is measured in number of persons that is persons who remained unemployed for a major part ot the year. This measure is more appropriate to those in search of regular employment. This is also referred to as open unemployment.
![]()
Question 5.
Weekly status unemployment.
Answer:
Persons who did not find even an hour of work during the survey week.
Question 6.
Structural unemployment.
Answer:
When demand for labour falls short to the supply of labour due to rapidly growing populatin and their immbility, the problem of unemployment appears in the economy. This type of unemployment is of long run nature Indian unemployment is basically related to this category.
Question 7.
Seasonal unemployment.
Answer:
Seasonal unemployment is contipued to the agricultural sector because nature predomi-nates agriculture. The demand for agricultural labour increases at the time of sowing and harvesting which provides employment for six to eight months and for the remaining period most of the agricultural workers remain unemployed.
Question 8.
Open unemployment.
Answer:
When the labourers live without any work and they don’t find any work to do, they come under the category of open unemployment. Educated unemployment and unskilled labour unemployment are included in open unemployment.
Question 9.
Educated unemployment.
Answer:
Even when a person who is educated / trained and skilled fails to obtain a job suited to his qualifications, he is said to be educated unemployed. Presently this type of unemployment has become a problem for developing economies, particularly for India.
Question 10.
Cyclical unemployment.
Answer:
The main cause of cyclical unemployment is the slackness in business activities. This type of unemployment is generally witnessed in the developed countries.
![]()
Question 11.
Disguised unemployment.
Answer:
A person whose marginal productivity zero or when more people are engaged in a job than actually required. We find his type of unemployment in agriculture in developing countries.
Question 12.
Frictional unemployment.
Answer:
The temporary unemployment which exists during the period to transfer of labour from one occupation to another is called frictional unemployment.
Question 13.
Non – employment.
Answer:
The people, who are working in their house hold activities or unorganised sector in de-veloping countries are treated as non – employment category.
Question 14.
Under employment.
Answer:
Under utilisation of labour time of workers, some of the workers classified as usually employed do not have work throughout the year due to seasonality in work or their labour time is not fully utilised.
Question 15.
Technological unemployment.
Answer:
When the introduction of new technology causes displacement of workers. It is called technological unemployment.
Question 16.
Poverty line.
Answer:
It refers to cut – off level of annual income of the household, poverty line is estimated separately bhsed oh nutritional diet of rural and urban areas, average consumption extendition of the poor / poverty line in this way, the poverty gap reflects the depth of poverty as well as its incidence.
Question 17.
Poverty gap.
Answer:
poverty gap thus measures the transfer that would bring the income of every poor person exactly up to the poverty line, there by eleminating the poverty. In this way the poverty gap results the depth of poverty, as well as its incidence. The poverty gap index is calculated with the help of following principle.
Poverty line – Average consumption
poverty gap = Poverty line
Question 18.
Absolute poverty.
Answer:
A person whose income is so meagre (or) low. It means the person is living below the subsistance level is known as absolute poverty.
![]()
Question 19.
Relative poverty.
Answer:
The people with lower income are relativele poor compared to the people with higher income. Even though they may be living above the minimum level of subsi scheme.
Question 20.
Multi dimensional Poverty Index (MPI)
Answer:
This concept was introduced by human development report – 2010 by replacing the HPI. The MPI is the product of the multi poverty head court and average number of deprivations each multidimensionally poor household experiences. It has three dimensions mirroring the HDI they are health, education and living standards.