Telangana TSBIE TS Inter 2nd Year English Study Material Reading Understanding Non-verbal Data Exercise Questions and Answers.
TS Inter 2nd Year English Reading Understanding Non-verbal Data
Q.No.9 (4 out of 6 Questions: 4 × 1 = 4 Marks)
Information is sometimes presented in a non-verbal way as the method has many advantages. It is very important for a student to develop the skill of understanding various types of non-verbal information. Asking questions based on a table, pie-chart etc., is one way to help the student improve this skill: One has to keenly study the text and the questions given after it before attempting to answer the questions.
PIE CHARTS
Study the following pie charts and answer the questions that follow.
1.
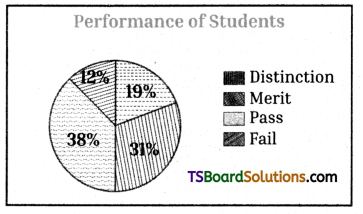
Answer the following questions.
i) How many segments are given in the pie chart ?
ii) What percentage of students just passed as shown in the chart ?
iii) What percentage of students got merit ?
iv) What is the total pass percentage of students?
v) What percentage of students got distinction?
vi) What is the combined percentage of students who just passed and who got merit?
vii) When compared, the number of students who passed with distinction are more than those passed with merit. Write true or false.
viii) If the total number of undergraduates appeared for the final year examination is 100, then how many students failed as per the chart?
Answers:
i) four
ii) 38
iii) 31
iv) 88
v) 19
vi) 69
vii) false
viii) 12
![]()
2.
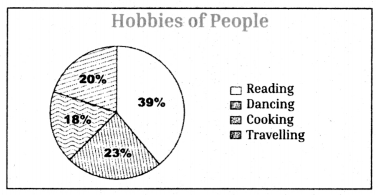
Answer the following questions.
i) What does the pie chart show?
ii) How many hobbies are presented in the pie chart?
iii) Which is the most preferred hobby?
iv) People with the hobbies of ___________ and __________ are almost equal to those with reading hobby. (Fill in the blanks.)
v) 30 percent of the people like dancing. Write true or false.
vi) Which is the least preferred hobby?
vii) People who have the hobby of cooking are 18%. Write true or false.
viii) If people who like cooking also liked dancing, then what would be’ the percentage of people who like dancing?
Answers:
i) hobbies of people
ii) four
iii) reading
iv) cooking – dancing
v) false
vi) cooking
vii) true
viii) 41
![]()
3.
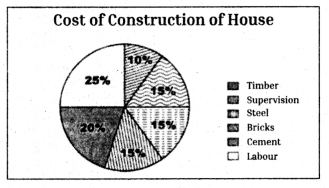
Answer the following questions.
i) What does the pie chart show ?
ii) How many categories are presented in the pie chart
iii) What portion of the total cost is spent on cement ?
iv) What portion of the total cost is spent on bricks ?
v) If the owner himself had supervised the construction of the house, what percentage of amount would he have saved?
vi) The cost spent on timber is 10%. Write true or false.
vii) If the cost of steel were lower than timber and the engineer had decided to use steel instead of timber, would the cost of entire house go down or go up ?
viii) What percentage of the cost is spent on supervision?
Answers:
i) Cost components of construction of a house
ii) 6
iii) 20%
iv) 15%
v) 15
vi) true
vii) go down
viii) 15
![]()
Bar Graphs
Study the following bar graphs and answer the questions that follow.
1.
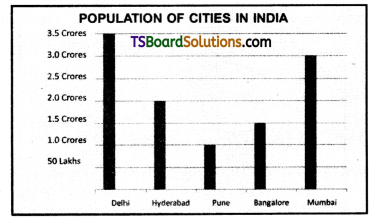
Answer the following questions.
i) What does the bar graph present ?
ii) Which is the least populated city ?
iii) The population of Hyderabad is ____________. (Fill in the blank.)
iv) Which city has the highest population?
v) Name the cities with a population of two crores or above.
vi) How many cities are presented in the bar graph?
vii) The population of Mumbai is ____________. (Fill in the blank.)
viii) The population of Bangalore is 1 crore. Write true or false
Answers:
i) Population of cities in India
ii) Pune
iii) 2.0 crore
iv) Delhi
v) Delhi, Mumbai and Hyderabad
vi) 5 (five)
vii) 3.0 crore
viii) false
![]()
2.
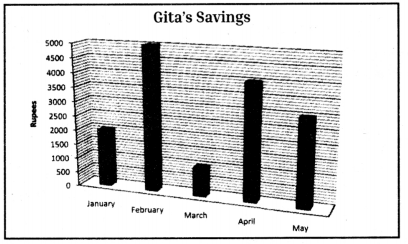
Answer the following questions.
i) What does the bar graph present?
ii) In which month did Gita save the highest amount?
iii) During which two months did Gita save very low amounts ?
iv) How much did Gita save in the month of May?
v) How much did she save in the month of April ?
vi) How much more did she save in April than in March ?
vii) How much money did Gita save in the month of March ?
viii) In the month of May, Gita saved Rs 300. Write true or false
Answers:
i) Gita’s savings (in 5 months)
ii) February
iii) January and March
iv) Rs. 2900
v) Rs. 3900
vi) Rs. 3000
vii) Rs. 900
viii) false
![]()
3.
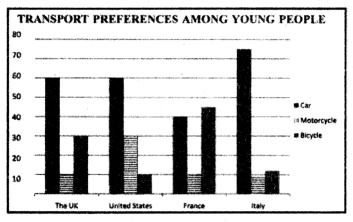
Answer the following questions.
i) What does the bar graph depict?
ii) How many modes of transport are mentioned in the bar graph?
iii) Which is the most preferred mode of transport in the US ?
iv) What percentage of people preferred bicycles in France?
v) In Italy which is the least preferred mode of transport?
vi) What percentage of people preferred motorcycle in the UK?
vii) Four modes of transport preferences are presented in the graph. Write true or false.
viii) What percentage of people preferred car in France?
Answers:
i) Transport preferences among young people
ii) three
iii) car
iv) 45%
v) motorcycle
vi) 10 percent
vii) false
viii) 40%
![]()
Tree Diagrams
Study the following bar graphs and answer the questions that follow.
1.
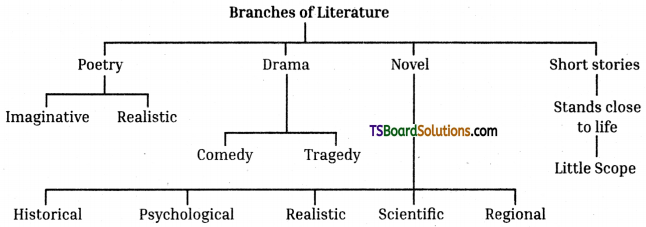
Answer the following questions.
i) What does the tree diagram describe? –
ii) How many main branches of literature are given in the diagram?
iii) In which branch of literature can one find imaginative aspect?
iv) Name anyone class of drama.
v) Which branch of literature stands close to life?
vi) Mention the number of classes novels are divided into here
vii) Historical approach can be seen ‘in novels. Write true or false.
viii) Regional approach can be seen in _____________. (Fill in the blank.)
Answers:
i) branches of literature
ii) (4) four
iii) in poetry
iv) comedy or tragedy
v) short stories
vi) five (5)
vii) true
viii) novels
![]()
2.
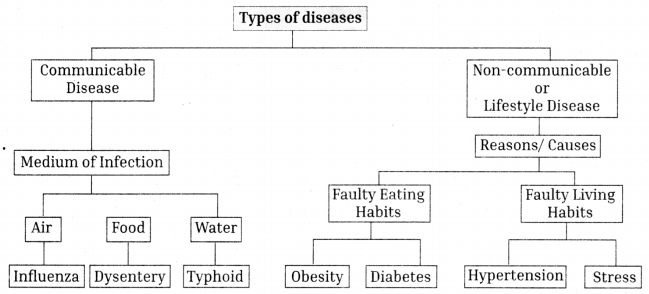
Answer the following questions.
i) What does the tree diagram describe?
ii) How many main types of diseases are shown in the diagram?
iii) Mention the reason for obesity.
iv) Name the medium of infection for typhoid.
v) Stress is caused by ____________ (Fill in the blank.)
vi) The medium of infection for influenza is ____________ (Fill in the blank.)
vii) Hypertension is caused by _____________ (Fill in the blank.)
viii) Three broad types of diseases are mentioned in the diagram. Write true or false.
Answers:
i) types of diseases
ii) two (2)
iii) faulty eating habits
iv) water
v) faulty living habits
vi) air
vii) faulty living habits
viii) false
![]()
3.
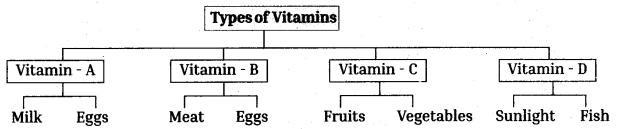
Answer the following questions.
i) What does the tree diagram describe?
ii) How many types of vitamins are mentioned in the diagram?
iii) Mention anyone source of vitamin A.
iv) Which vitamin does meat provide us ?
v) From which food do we get vitamin C ?
vi) Sunlight helps us get _______________ (Fill in the blank.)
vii) Eggs are rich in vitamins ___________ and _____________ (Fill in the blanks.)
viii) Which vitamin do we get from milk?
Answers:
i) types of vitamins
ii) four (4)
iii) milk or eggs
iv) vitamin B
v) fruits and vegetables
vi) vitamin D
vii) A and B
viii) vitamin A
![]()
Tables
1. Information of Sports
| Sports | Number of players of a Team in Field at a Time | Length of Field or Court | Shape of Projectile | Surface of Field or Court |
| Base Ball | 9 | 27.4m | sphere | grass |
| Basket Ball | 5 | 28.6m | sphere | wood |
| Cricket | 11 | 137-l50m | sphere | grass |
| Curling | 4 | 46m | Flattened sphere | ice |
| Ice Hockey | 11 | 61m | cylinder | ice |
| Larcosse | 10 | 101m | sphere | grass |
| Rugby | 15 | 144m | ovoid | grass |
| US Football | 11 | 110m | Pointed ovoid | grass |
Answer the following questions.
i) What does the table show?
ii) How many sports are represented on this table?
iii) Of these sports, which has the highest number of players on the field?
iv) Which of these sports is played on a wooden surface?
v) How many of these sports have 11 players on the field at a time?
vi) Which of these sports is played with a cylindrical projectile?
vii) How many of these sports are played on ice ?
viii) Of these sports, which one has the fewest players on the field at a time?
Answers:
i) Information of sports
ii) eight (8)
iii) Rugby (football)
iv) Basket Ball
v) three (3)
vi) Ice Hockey
vii) two (2)
viii) Curling
![]()
2.
| Continent | Area | Number of Countries | Population |
| Africa | ll,608,000sq.km | 54 | 1,373,486,472 |
| Antartica | 5,100,000 sq.km | 0 | 0 |
| Asia | 17,212,000 sq.km | 48 | 4,679,660,580 |
| Australia and Oceania | 2,968,000 sq.km | 14 | 43,219,954 |
| Europe | 8,370,000 sq.km | 43 | 747,747,396 |
| North America | 9,365,000 sq.km | 23 | 596,591,592 |
| South America | 6,880,000 sq.km | 12 | 434,260,138 |
Answer the following questions.
i) What does the table’ show ?
ii) How many continents are mentioned in the table?.
iii) Which continent has the largest area ?
iv) Which continent has the smallest number of countries?
v) Which is the most populous continent?
vi) Africa has the highest number of countries. Write true or false.
vii) How many countries does North America have?
viii) Which continent has the smallest area?
Answers:
i) Continents, their area, number of countries and their population
ii) Seven (7)
iii) Asia
iv) South America (of course, Antartica has not countries)
v) Asia
vi) true
vii) 23
viii) Australia and Oceania
![]()
3.
| S.No. | Name of the winner | Field | Year |
| 01. | Rabindranath Tagore | Literature | 1913 |
| 02. | C.V. Raman | Physics | 1930 |
| 03. | Har Gobind Khorana | Medicine | 1968 |
| 04. | Mother Teresa | Peace | 1979 |
| 05. | Subrahmanyan Chandrasekhar | Physics | 1983 |
| 06. | Amartya Sen | Economics | 1998 |
| 07. | Venkataraman Ramakrishnan | Chemistry | 2009 |
| 08. | Kailash Satyarthi | Peace | 2014 |
| 09. | Abhijit Banerjee | Economics | 2019 |
Answer the following questions.
i) What does the table show?
ii) How many Indians have received the Nobel Prize to date?
iii) Who is the first Indian to receive the Nobel Prize?
iv) Mother Teresa received the Nobel Prize for ____________ (Fill in the blank.)
v) How many Indians have received the Nobel Prize for Economics till now?
vi) In which year did C V Raman receive the Nobel Prize?
vii) Who won the Nobel Prize in the year 2014?
viii) In the field of Medicine, who won the Nobel Prize for India?
Answers:
i) Indian Nobel Prize winners
ii) nine (9)
iii) Rabindranath Tagore
iv) Peace
v) two (2)
vi) 1930
vii) Kailash Satyarthi
viii) Har Gobind Khorana
![]()
Flow Charts
Study the following bar graphs and answer the questions that follow.
1.
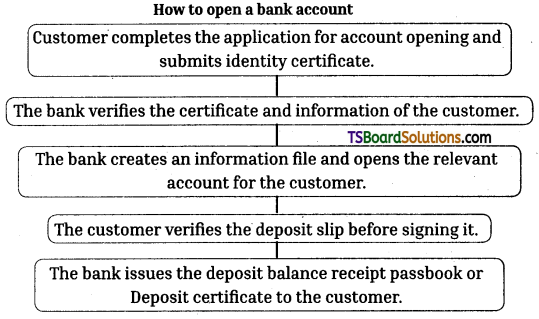
Answer the following questions.
i) What does the flow chart show?
ii) How many steps are given in the flow chart?
iii) What should the customer do after completing the application for account opening?
iv) Who verifies certificates and information of the customer?
v) Where does the customer need to sign ?
vi) What does the bank issue at last?
vii) What step comes before issuing the deposit certificate to the customer?
viii) What does the bank open for the customer?
Answers:
i) the process of opening a bank account
ii) five (5)
iii) Submit it along with identity certificate
iv) the bank (persons)
v) on the deposit slip
vi) balance receipt passbook
vii) Customer signs on the deposit slip
viii) an account
![]()
2.
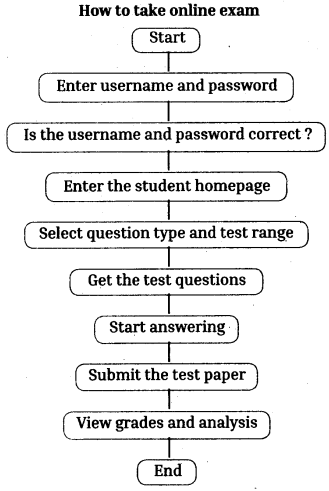
Answer the following questions.
i) What does the flow chart describe ?
ii) How many steps are given in the flow chart ?
iii) After starting, what should be done ?
iv) When can one start answering ?
v) When can one submit a test paper ?
vi) Where can one select the question type and test range ?
vii) When can one enter the student homepage ?
viii) If one enters the wrong user name, what should be done ?
Answers:
i) the process of taking an online examination
ii) ten (10)
iii) enter the user name and password
iv) after getting the test questions
v) after completing answering questions
vi) on the student homepage
vii) after entering user name and password correctly
viii) should reenter it
![]()
3.
How to get driving licence
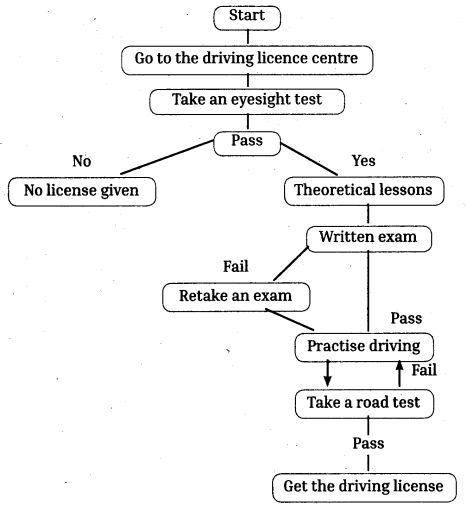
![]()
Answer the following questions.
i) What does the flow chart describe?
ii) How many steps are given in the flow chart?
iii) What test should one pass to go for a written test?
iv) What happens when one doesn’t pass the eyesight test?
v) What should one do after clearing the eyesight test?
vi) What happens when one fails the written exam?
vii) What happens when one clears the written exam?
viii) What can the applicant do after practising driving?
Answers:
i) the process of getting a Driving License
ii) eight (8) [if fails nine (9]
iii) eyesight test
iv) loses the chance to get a driving license
v) take theoretical lessons and written test
vi) retake the written test
vii) practises driving
viii) take the road test