Students must practice these Maths 2A Important Questions TS Inter Second Year Maths 2A Measures of Dispersion Important Questions Long Answer Type to help strengthen their preparations for exams.
TS Inter Second Year Maths 2A Measures of Dispersion Important Questions Long Answer Type
Question 1.
Find the mean deviation about the mean for the following continuous distribution. [AP – Mar. 2015]

Solution:
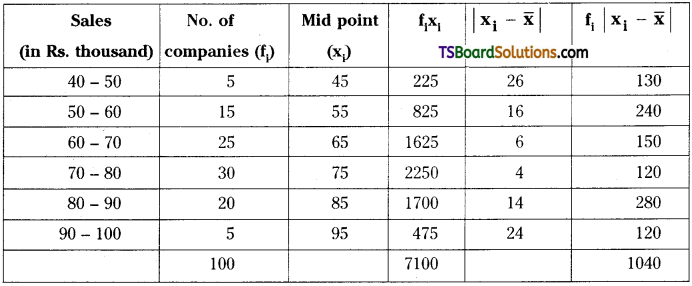
Here, Σfi = 100
Σfixi = 7100
∴ Mean \(\frac{\sum_{\mathrm{i}=1}^{\mathrm{n}} \mathrm{f}_{\mathrm{i}} \mathrm{x}_{\mathrm{i}}}{\mathrm{N}}=\frac{7100}{100}\) = 71
∴ Mean deviation about mean is M.D = \(\frac{\Sigma \mathrm{f}_{\mathrm{i}}\left|\mathrm{x}_{\mathrm{i}}-\overline{\mathrm{x}}\right|}{\mathrm{N}}=\frac{1040}{100}\) = 10.4.
Question 2.
Find the mean deviation about the mean for the following continuous distribution.

Solution:
We can form the following table from the given data :
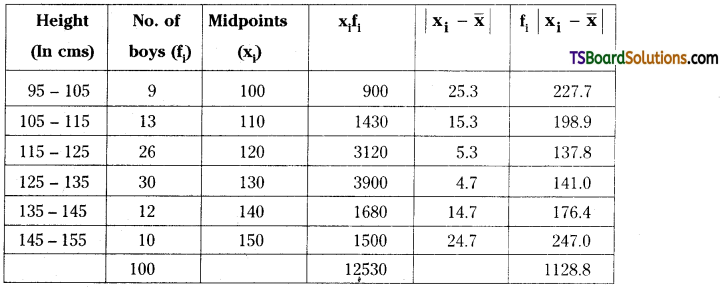
Here, N = Σfi = 100
Σfixi = 12530
∴ Mean, \(\bar{x}=\frac{\sum_{i=1}^n f_i x_i}{N}=\frac{12530}{100}\) = 125.3
∴ Mean deviation about mean is M.D = \(\frac{\Sigma \mathrm{f}_{\mathrm{i}}\left|\mathrm{x}_{\mathrm{i}}-\overline{\mathrm{x}}\right|}{\mathrm{N}}\)
= \(\frac{1128.8}{100}\)
= 11.288 = 11.28.
![]()
Question 3.
Find the mean deviation from the mean of the following data, using the step deviation method. [AP – Mar. ’18; TS – Mar. 2016]

Solution:
We can form the following table from the given data :
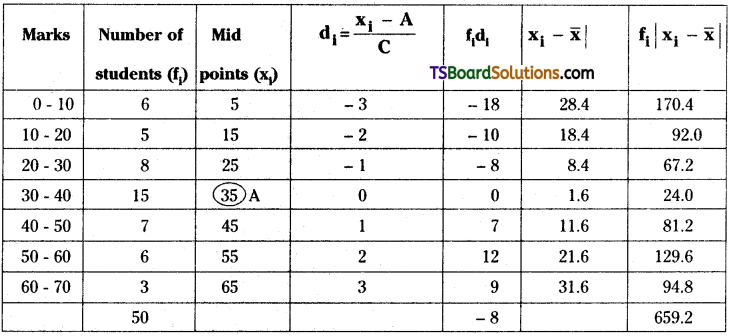
Let the assumed mean be A = 35
Here, C = 10
N = Σfi = 50
Mean, \(\bar{x}=A+\frac{\sum_{i=1}^n f_i d_i}{N} \times C\)
= \(A+\frac{\sum_{i=1}^7 f_i d_i}{N} \times C\)
= 35 + \(\frac{(-8)}{50}\) × 10
= 35 – 1.6 = 33.4
∴ Mean deviation about mean is M.D = \(\frac{\Sigma f_{\mathrm{i}}\left|\mathrm{x}_{\mathrm{i}}-\overline{\mathrm{x}}\right|}{\mathrm{N}}=\frac{659.2}{50}\) = 13.185.
Question 4.
Find the mean deviation about the mean for the given data using step deviation method. [AP – Mar. ’17, ’16, AP – May 2015] [TS – Mar. ’18, May ’16]

Solution:
We can form the following table from the given data:
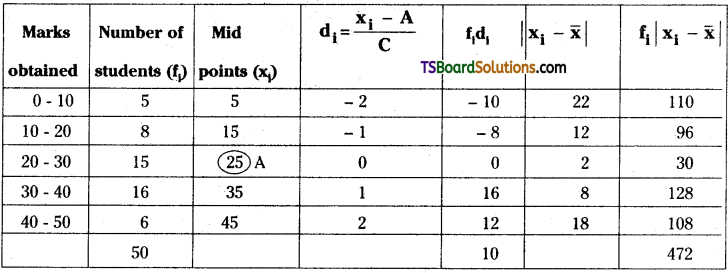
Let the assumed mean be A = 25
Here, C = 10
N = Σfi = 50
\(\bar{x}=A+\frac{\sum_{i=1}^n f_i d_i}{N} \times C\)
= \(\mathrm{A}+\frac{\sum_{\mathrm{i}=1}^5 \mathrm{f}_{\mathrm{i}} \mathrm{d}_{\mathrm{i}}}{\mathrm{N}} \times \mathrm{C}\)
= 25 + \(\frac{10}{50}\) × 10 = 27
∴ Mean deviation about mean is M.D = \(\frac{\Sigma \mathrm{f}_{\mathrm{i}}\left|\mathrm{x}_{\mathrm{i}}-\overline{\mathrm{x}}\right|}{\mathrm{N}}=\frac{472}{50}\) = 9.44.
![]()
Question 5.
Find the mean deviation about the median for the following continuous distribution.

Solution:
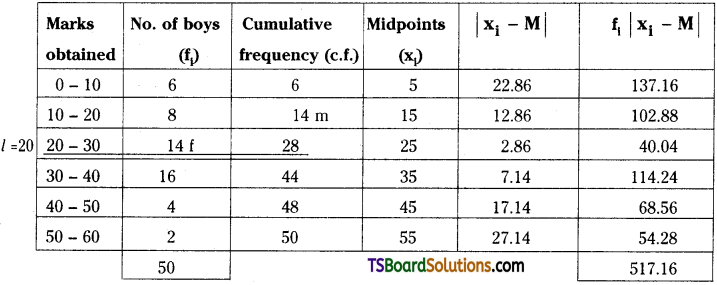
Median class = Class containing \(\frac{N}{2}^{\text {th }}\) item
= \(\frac{50}{2}\) = 25 item
= 20 – 30 class
Here, l = 20, C = 10, f = 14, m = 14, N = 50
∴ Median, M = l + \(\frac{\frac{N}{2}-m}{f}\) × C
= 20 + \(\frac{25-14}{14}\) × 10
= 20 + 7.86 = 27.86
∴ Mean deviation about median is M.D = \(\frac{\Sigma \mathrm{f}_{\mathrm{i}}\left|\mathrm{x}_{\mathrm{i}}-\mathrm{M}\right|}{\mathrm{N}}\)
= \(\frac{517.16}{50}\) = 10.34
Question 6.
Find the mean deviation about median for the following data.

Solution:
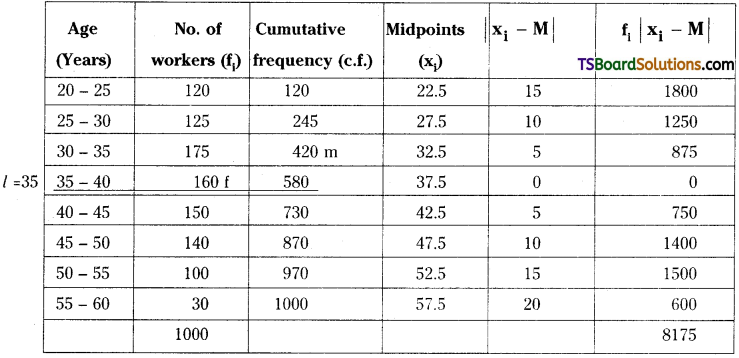
Median class = Class containing \(\frac{\mathrm{N}^{\text {th }}}{2}\) item
= \(\frac{1000}{2}\) = 500th item = 35 – 40 class
Here, l = 35, C = 5, f = 160, m = 420, N = 1000
∴ Median, M = l + \(\frac{\frac{N}{2}-m}{f}\) × C
= 35 + \(\frac{500-420}{160}\) × 5
= 35 + 2.5 = 37.5
∴ Mean deviation about median is M.D = \(\frac{\Sigma \mathrm{f}_{\mathrm{i}}\left|\mathrm{x}_{\mathrm{i}}-\mathrm{M}\right|}{\mathrm{N}}=\frac{8175}{1000}\) = 8.175.
![]()
Question 7.
Calculate the variance and standard deviaon,of the following continuous frequency distribution.
[AP – May 2016; TS – Mar. 2017; Mar. ‘14, Board Paper]

Solution:
We can form the following table from the given data:
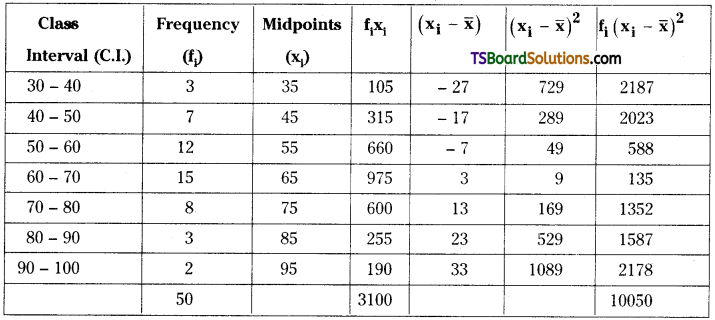
∴ Mean, \(\bar{x}=\frac{1}{N} \sum_{i=1}^7 f_i x_i=\frac{3100}{50}\) = 62
Variance, σ2 = \(\frac{1}{N} \sum_{i=1}^7 f_i\left(x_i-\bar{x}\right)^2\)
= \(\frac{1}{50}\) (10050) = 201
Standard deviation, σ = \(\sqrt{\frac{1}{N} \sum_{i=1}^7 f_i\left(x_i-\bar{x}\right)^2}\)
= \(\sqrt{\text { variance }}=\sqrt{201}\)= 14.17 (approximately).
Question 8.
The following table gives the daily wages of workers in a factory. Compute the standard deviation and the coefficient of variation of the wages of the workers.

Solution:
We shall solve this problem using the step deviation method, since the midpoints of the class intervals are numerically large.
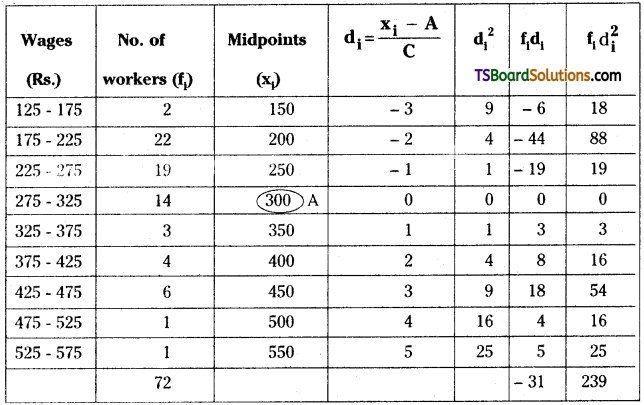
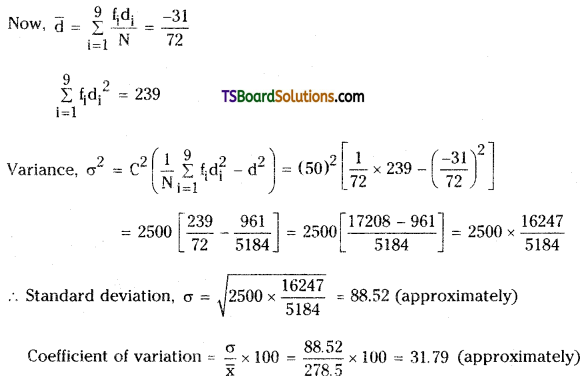
From the table, N = \(\sum_{i=1}^9\) fi = 72
Let the assumed mean, A = 300
Here, C = 50
From the table, \(\sum_{i=1}^9\) fidi = – 31
Mean, \(\bar{x}=A+\frac{\sum_{i=1}^9 f_i d_i}{N}\) × C
= 300 + \(\frac{-31}{72}\) × 50
= 300 – \(\frac{1550}{72}\)
= 278.5 (approximately)
![]()
Question 9.
The scores of two cricketers A and B in 10 innings are given below. Find who is a better run getter and who is a more consistent player.

Solution:
For cricketer A : Scores of A are 40, 25, 19. 80, 38, 8, 67, 121, 66, 76
∴ Mean, \(\overline{\mathrm{x}}_{\mathrm{A}}=\frac{\text { Sum of the scores }}{\text { No. of innings }}\)
= \(\frac{40+25+19+80+38+8+67+121+66+76}{10}\)
= \(\frac{540}{10}\) = 54
The deviations of the respective observations from the mean i.e., xi – \(\overline{\mathrm{x}}\) are: – 14, – 29, – 35, 26, – 16, -46, 13, 67, 12, 22
Variance, σ2 = \(\frac{1}{n} \sum_{i=1}^{10}\left(x_i-\bar{x}\right)^2\)
= \(\frac{196+841+1225+676+256+2116+169+4489+144+484}{10}\)
= \(\frac{10596}{10}\) = 1059.6
Standard deviation, σA = \(\sqrt{1059.6}\) = 32.55
C.V of A = \(\frac{\sigma_{\mathrm{A}}}{\overline{\mathrm{x}}_{\mathrm{A}}}\) × 100
= \(\frac{32.55}{54}\) × 100 = 60.28.
For cricketer B:
Scores of B are 28, 70, 31, 0, 14, 111, 66, 31, 25, 4
Mean \(\overline{\mathrm{x}}_{\mathrm{B}}=\frac{\text { Sum of the scores }}{\text { No. of innings }}\)
= \(\frac{28+70+31+0+14+111+66+31+25+4}{10}=\frac{380}{10}\)
= 38
The deviations of the respective observations from mean i.e., (xi – \(\overline{\mathbf{x}}\)) are: – 10, 32, – 7, – 38, – 24, 73, 28, – 7, – 13, – 34
Variance, σB2 = \(\frac{1}{n} \sum_{i=1}^{10}\left(x_i-\bar{x}\right)^2\)
= \(\frac{100+1024+49+1444+576+5329+784+49+169+1156}{10}\)
= \(\frac{10680}{10}\) = 1068
Standard deviation. σB = \(\sqrt{1068}\) = 32.68
C.V of B = \(\frac{\sigma_B}{\bar{x}_B}\) × 100
= \(\frac{32.68}{38}\) × 100 = 86
Since, \(\overline{\mathbf{x}}_{\mathrm{A}}\) is greater than \(\overline{\mathbf{x}}_{\mathrm{B}}\) then cricketer A is better run getter (scorer).
Since, C.V of A is less than C.V of B then cricketer ¡s also a more consistent player.
Question 10.
From the prices of shares X and Y given below, for 10 days of trading, find out which share is more stable?

Solution:
Share X:
Prices of share X are 35, 54, 52, 53, 56, 58, 52, 50, 51, 49
Mean, \(\overline{\mathrm{x}}_{\mathrm{X}}=\frac{1}{\mathrm{~m}} \sum_{\mathrm{i}=1}^{10} \mathrm{x}_{\mathrm{i}}\)
= \(\frac{510}{10}\) = 51
The deviations of the respective observations from mean i.e., (xi – \(\overline{\mathrm{x}}\))2 are: – 16, 3, 1, 5, 7, 1, – 10, – 2
Variance, σX2 = \(\frac{1}{n} \sum_{i=1}^{10}\left(x_i-\bar{x}\right)^2\)
= \(\frac{256+9+1+25+49+1+1+0+4}{10}\)
= \(\frac{350}{10}\) = 35
Standard deviation, σx = √35 = 5.9 (approximately)
C.V of X = \(\frac{\sigma_X}{\bar{x}_X}\) × 100
= \(\frac{5.9}{51}\) × 100 = 11.5 (approximately)
Share Y:
Prices of share Y are 108, 107, 105. 105, 106, 107, 104, 103, 104, 101
Mean, \(\overline{\mathrm{x}}_{\mathrm{Y}}=\frac{1}{\mathrm{n}} \sum_{\mathrm{i}=1}^{10} \mathrm{x}_{\mathrm{i}}\)
= \(\frac{1050}{10}\) = 105
The deviations of the respective observations from mean i.e.. (xi – \(\overline{\mathrm{x}}\)) are 3, 2, 0, 0, 1, 2, – 1, – 2, – 1, – 4
Variance, σY2 = \(\frac{1}{n} \sum_{\mathrm{i}=1}^{10}\left(\mathrm{x}_{\mathrm{i}}-\overline{\mathrm{x}}\right)^2\)
= \(\frac{9+4+0+0+1+4+1+4+1+16}{10}\)
= \(\frac{40}{10}\) = 4
Standard deviation, σY = √4 = 2
C.V. of Y = \(\frac{\sigma_Y}{\bar{x}_Y}\) x 100
= \(\frac{2 \times 100}{105}\) x 100 = 1.904
Since, C.V of X is greater than C.V of Y then the share of Y is more consistent (stable).
![]()
Question 11.
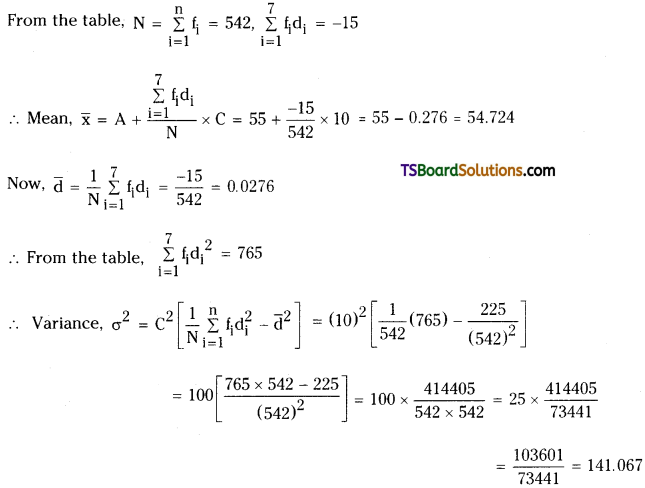
Find the mean and variance using the step deviation method of the following tabular data, giving the age distribution of 542 members.

Solution:
We form the following table From the given data:
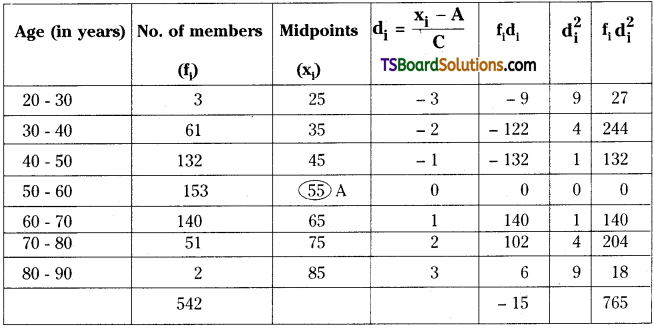
Let the assumed mean, A = 55
Here, C = 10
Some More Maths 2A Measures of Dispersion Important Questions
Question 12.
Students of two sections A and B of a class show the following performance in a test (conducted 100 marks).

Which section of students has greater variability In performance?
Solution:
Given that,

The variance of distribution of marks of section A is σ12 = 64
∴ The standard deviation of distribution of marks of section A is σ1 = 8
The variance of distribution of marks of section B is σ22 = 81
∴ The standard deviation of distribution of marks of section B is σ2 = 9
The average marks in the test of section A is \(\bar{x}_1\) = 45
The average marks in the test of section B is \(\bar{x}_2\) = 45
∵ The average marks in the test of both sections of students is the same i.e., 45.
The standard deviation of the distribution of marks in section B is greater than the standard deviation of (he distribution of marks in section A.
Hence, the section B has greater variability in the performance.
![]()
Question 13.
Find the variance and standard deviation of the following frequency distribution.

Solution:
From the given data, we can form the following table:
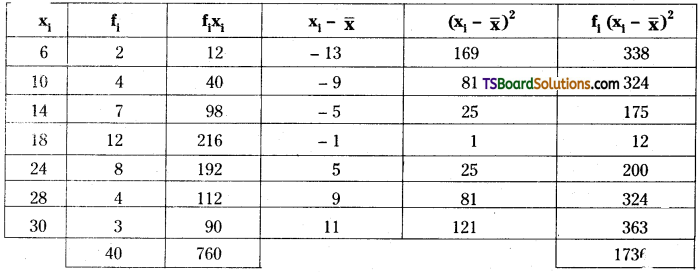
Mean of the given data is (\(\overline{\mathrm{x}}\)) = \(\frac{1}{N} \sum_{i=1}^7 f_i x_i\)
= \(\frac{760}{40}\) = 19
Variance, σ2 = \(\frac{1}{N} \sum_{i=1}^7 f_i\left(x_i-\bar{x}\right)^2\)
= \(\frac{1}{40}\) (1736) = 43.4
Standard deviation, σ = \(\sqrt{\text { variance }}\)
= \(\sqrt{43.4}\) = 6.58 (approximately).
Question 14.
Calculate the variance and standard deviation for a discrete frequency distribution.

Solution:
From the given data, we can form the following table:
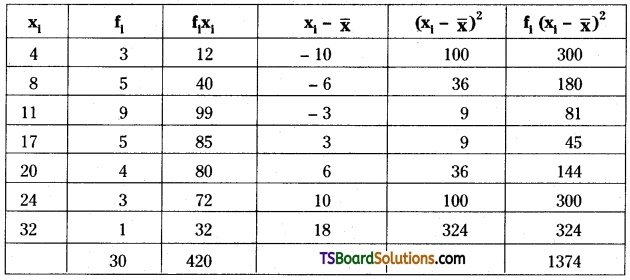
Mean of the given data is (\(\overline{\mathrm{x}}\)) = \(\frac{1}{N} \sum_{i=1}^n f_i x_i\)
= \(\frac{1}{N} \sum_{i=1}^7 f_i x_i=\frac{420}{30}\) = 14
Variance, σ2 = \(\frac{1}{N} \sum_{i=1}^7 f_i\left(x_i-\bar{x}\right)^2\)
= \(\frac{1}{30}\) (1374) = 45.8
Standard deviation, σ =\(\sqrt{\text { variance }}\)
= \(\sqrt{45.8}\) = 6.76 (approximately).
![]()
Question 15.
Find the mean deviation about the median for the following data.

Solution:
We can form the following table from the given data:
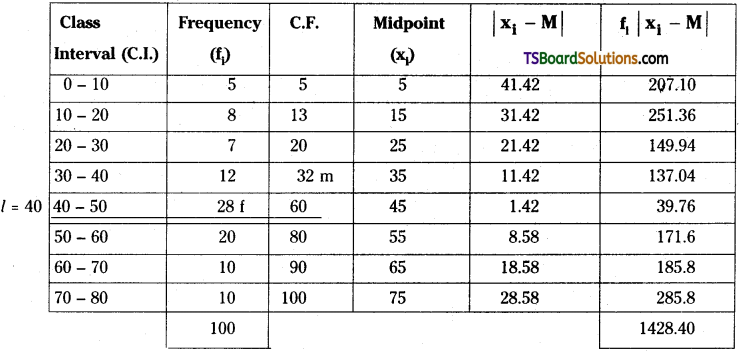
Median class = Class containing \(\frac{N^{t h}}{2}\) item
= \(\frac{100}{2}\) = 50th item = 40 – 50 class
Here, l = 40, f = 28, m = 32, C = 10, N = 100
∴ Median, M = l + \(\frac{\frac{\dot{N}}{2}-\mathrm{m}}{\mathrm{f}}\) × C
= 40 + \(\frac{50-32}{28}\) × 10
= 40 + \(\frac{180}{28}\)
= 40 + 6.42 = 46.42
∴ Mean deviation about median is M.D = \(\frac{\Sigma \mathrm{f}_{\mathrm{i}}\left|\mathrm{x}_{\mathrm{i}}-\mathrm{M}\right|}{\mathrm{N}}=\frac{1428.4}{100}\) = 14.284
Question 16.
Lives of two models of refrigerators A and B obtained ¡n a survey are given below.

From the above data suggest which model to purchase.
Solution:
Model – A:
To find the mean and variance of lives of model A refrigerators, we shall construct the following table:

From the table, N = \(\sum_{\mathbf{i}=1}^5\) fi = 46, \(\sum_{\mathbf{i}=1}^5\) fixi = 212
Mean, \(\bar{x}_A=\frac{1}{N} \sum_{i=1}^5 f_i x_i\)
= \(\frac{212}{46}\) = 4.6
From the table, \(\sum_{i=1}^5 f_i\left(x_i-\bar{x}\right)^2\) = 244.96
Variance, σA2 = \(\frac{1}{N} \sum_{i=1}^5 f_i\left(x_i-\bar{x}\right)^2\)
= \(\frac{244.96}{46}\) = 5.32
Standard deviation, σA = \(\sqrt{5.32}\)
= 2.3 (approximately)
Coefficient of variation of model A = \(\frac{\sigma_{\mathrm{A}}}{\mathrm{x}_{\mathrm{A}}}\) × 100
= \(\frac{2.3}{4.6}\) × 100
= 50 (approximately).
![]()
Model B:
To find the mean and variance of lives of model B refrigerators, we shall construct the following table:

From the table, N = \(\sum_{i=1}^5\) fi = 49
\(\sum_{i=1}^5\) fixi = 297
Mean, \(\bar{x}_B=\frac{1}{N} \sum_{i=1}^5 f_i x_i\)
= \(\frac{297}{49}\) = 6.06
From the table, \(\) = 224.8164
Variance, σB2 = \(\frac{1}{N} \sum_{i=1}^5 f_i\left(x_i-\bar{x}\right)^2\)
= \(\frac{224.8164}{49}\) = 4.58 (approximately)
Standard deviation, σB = \(\sqrt{4.58}\)
= 2.1 (approximately)
Coefficient of variation of model B = \(\frac{\sigma_B}{x_B}\) × 100
= \(\frac{2.1}{6.06}\) × 100 = 34.65 (approximately)
Since C.V. of model B is less than C.V. of model A then the model B is more consistent than the model A with regard to life in years.
Hence, we suggest model B for purchase.