Telangana TSBIE TS Inter 1st Year Economics Study Material 10th Lesson Basic Statistics for Economics Textbook Questions and Answers.
TS Inter 1st Year Economics Study Material 10th Lesson Basic Statistics for Economics
Long Answer Questions
Question 1.
Explain one dimensional diagram with suitable examples.
Answer:
The following are the common types of diagrams, which are used in statistical analysis.
One Dimensional Diagrams :
In such diagrams only one dimensional measurement, i.e, height is used, the width is not considered.
a) Simple Bar Diagrams :
Simple bar diagrams are used to present individual observations, time series and spatial series.
b) Sub – divided Bar Diagrams :
In a sub-divided bar diagram, the bar is subdivided into various parts in proportion to the values given in the data and the whole bar represents the total. Such diagram is also called “components bar diagram”. Such a diagram shows total as well as various components.
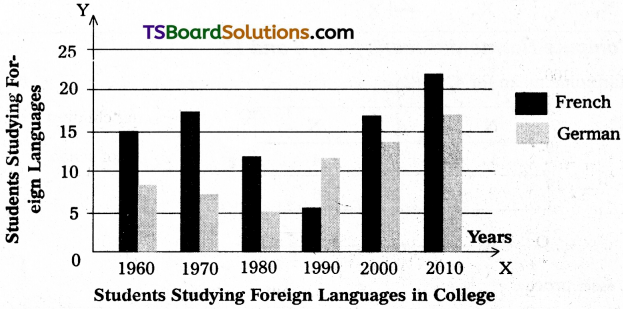
c) Multiple Bar Diagrams :
Such diagrams are used to compare two or more variables. The method of drawing multiple bar diagrams is shown in figure with the help of an example.
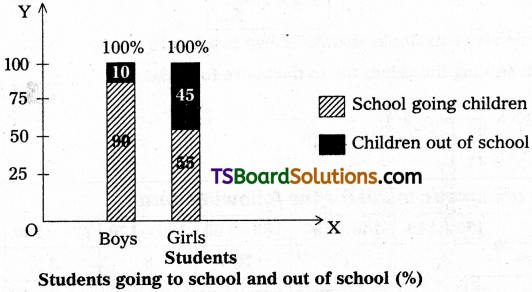
d) Percentage Bar Diagram :
Relative changes are studied with the help of percentage bar diagrams. The length of the bar is treated as 100 units. Each bar is divided on the basis of percentage.
![]()
Quetion 2.
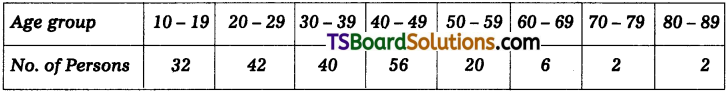
Calculate arithmetic mean from the following data.
Answer:
The above data relates to inclusive method changed into exclusive method. Deduc¬tive 0.5 from lower limit, add 0.5 to upper limit changed as above data.
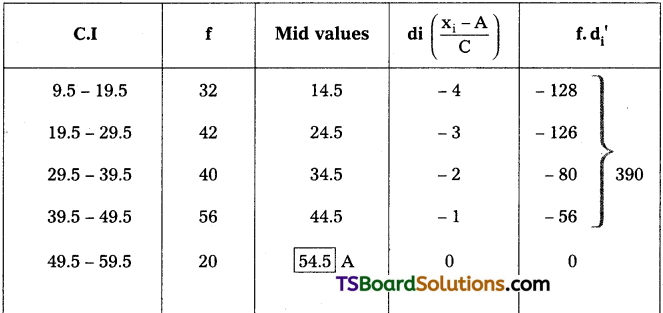
Here, A = Assumed mean = 54.5
∑ fd’ Sum of the product of deviations (d) taken from the assumed mean multiplied with its respective frequencies = – 374
N = Total no. of frequencies = 200
i = Class interval = 10
Substitute these values in above equation
\(\overline{\mathrm{x}}\) = 54.5 + (\(\frac{-374}{200}\)) × 10
= 54.5 + (-1.87) × 10 = 54.5 + (-18.7)
\(\overline{\mathrm{x}}\) = 35.8
Question 3.
Compute median for the data given below.

Solution:
| Classes C.I | Persons f | CF (Cumulative frequency) |
| 0-10 | 5 | 5 |
| 10 -20 | 10 | 15 |
| 20-30 | 25 | 40 CF |
| L1 30 – 40 | 30 f | 70 |
| 40-50 | 20 | 90 |
| 50-60 | 10 | 100 |
| N = 100 |
Median = L1(\(\frac{\frac{N}{2}-C F}{f}\)) × i
Location of median class = \(\frac{N^{th}}{2}\) item
= \(\frac{100^{th}}{2}\)
= 50th item
L1 = Lower limit of the median class = 30 N
\(\frac{N}{2}\) = Median value = 50
CF = Cumulative frequency of the class preceeding to the median class = 40
f = Frequency of the median class = 30
i = class interval = 10
Substitute these values in the above formula
= 30 + (\(\frac{50-40}{30}\)) × 10
= 30 + (\(\frac{10}{30}\)) × 10
= 30 + (0.33) × 10
= 30 + 3.33 = 33.3
∴ Median = 33.3
Question 4.
Locate modal value for the below given data.
Answer:
Grouping Classification Table
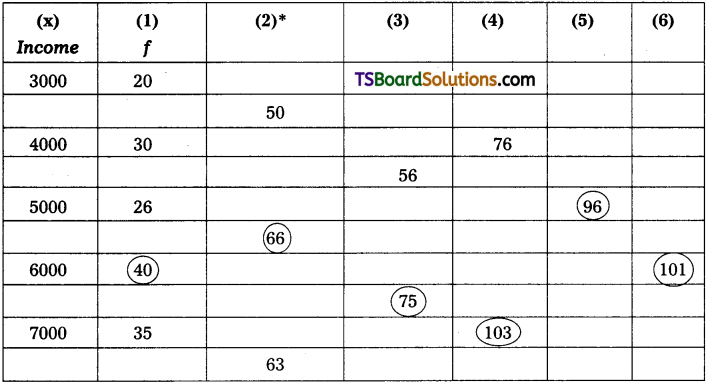
(2)* = figure arrived at by adding ‘f’ of two rows each.
(3)* = figure arrived at by adding ‘f’ of two rows each leaving first row.
(4)* = figure arrived at by adding ‘f’ of three rows each.
(5)* = figure arrived at by adding ‘f’ of three rows each leaving first row.
(6)* = figure arrived at by adding ‘f’ of three rows each leaving second row.
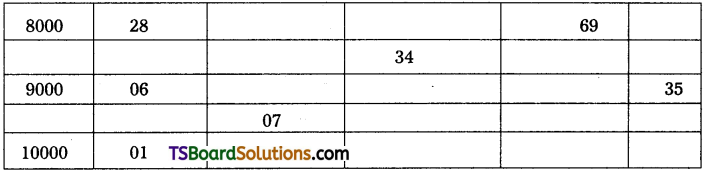
The analysis table, presented below, is prepared with the help of classification table,
Analysis Table
From the analysis table, it is found that 6000 has occurred many times, i.e., 6 times. Therefore, Z = 6000
Question 5.
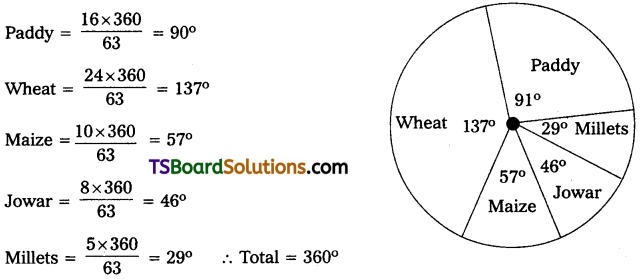
Draw the pie diagram for following data.
Solution:
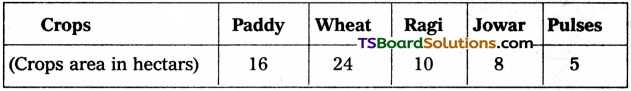
Area changed into Degree =
Short Answer Questions
Question 1.
What is Statistics? Explain its relationship with Economics. [Mar.’17]
Answer:
There is a close relationship between statistics and economics. In the words of Tugwell, “The science of economics is becoming statistical in its method”. All the economic laws are pronounced on the basis of statistical facts and figures. The theory of population of Malthus, the law of family expenditure of Engels etc., were propounded after statistical tests. Statistics helps the economics to become an exact science.
In the study of theoretical economics, the application and use of statistical methods are of great importance. Most of the doctrines of economics are based on the study of a large number of units and their analysis. This is done through statistical methods. Law of demand was formulated because of statistical methods.
The importance of statistics is felt in all branches of knowledge in accountancy and auditing in banking, in insurance, in research and in many fields. Without statistics no branch of knowledge is complete.
![]()
Question 2.
Explain simple and sub – divided bar diagrams with examples.
Answer:
The following are the common types of diagrams, which are used in statistical analysis.
1. One Dimensional Diagrams :
In such diagrams only one dimensional measurement, i.e, height is used, the width is not considered.
1) Simple Bar Diagrams :
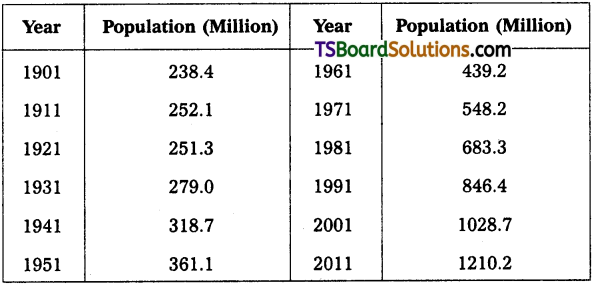
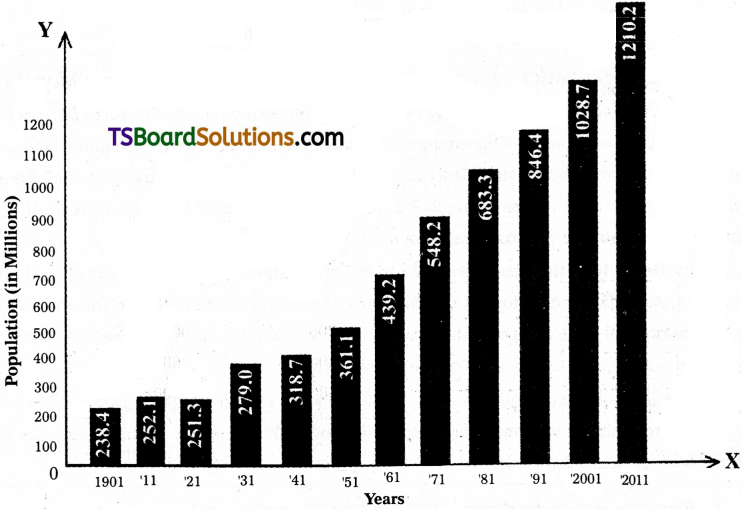
Simple bar diagrams are used to present individual observations, time series and spatial series. The method of drawing simple bar diagram is explained with the help of the example.
Example :
Draw the simple diagram from the following data relating to Censs of India from 1901 to 2011.
Population from 1901 to 2011
2. Subdivided Bar Diagram :
Component bar diagram charts are also called as sub-divided bar diagrams, which are very useful in comparing the sizes of different component parts.
The following data relates to the number of companies registered in a country.
Registered Companies

Question 3.
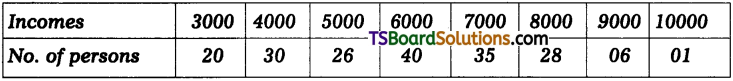
Calculate arithmetic mean for the data given below.
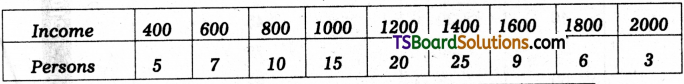
Solution:
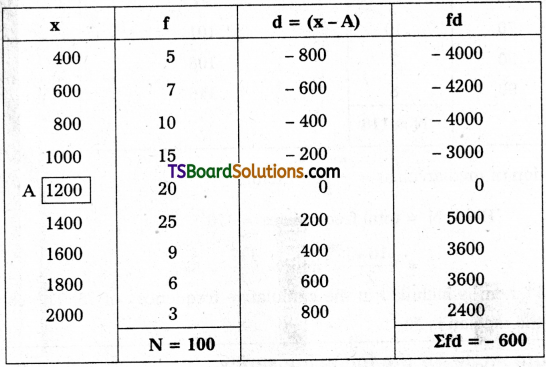
\(\overline{\mathrm{X}}\) = A + \(\frac{\Sigma \mathrm{fd}}{\mathrm{N}}\)
Here, \(\overline{\mathrm{X}}\) = Mean
A = Assumed mean = 1200
∑fd = Sum of product of the step deviation (d¹) taken from the assumed mean multiplied with its respective frequencies -600
N = Total no. of frequencies = 100
Substitute these values in above formula
= 1200 + \(\frac{-600}{100}\)
= 1200 + (-6) = 1194
∴ \(\overline{\mathrm{X}}\) = 1194
Question 4.
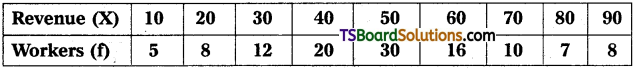
Calculate median for the following data.
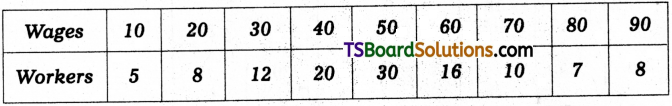
Solution:
| x | f | cf (Cumulative frequence) |
| 10 | 5 | 5 |
| 20 | 8 | 13 |
| 30 | 12 | 25 |
| 40 | 20 | 45 |
| 50 | 30 | 75 |
| 60 | 16 | 91 |
| 70 | 10 | 101 |
| 80 | 7 | 108 |
| 90 | 8 | 116 |
| N = 116 |
Location of median class = \(\frac{N+1^{th}}{2}\) item
Here, N = total frequencies =116
\(\frac{116+1^{th}}{2}\) item = \(\frac{117}{2}\) = 58.5
The 58.5th item is included in the cumulative frequencey of 75. The corresponding class of the median is 50.
Question 5.
Calculate mode for the following series.
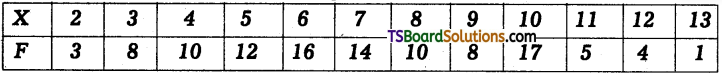
Answer:
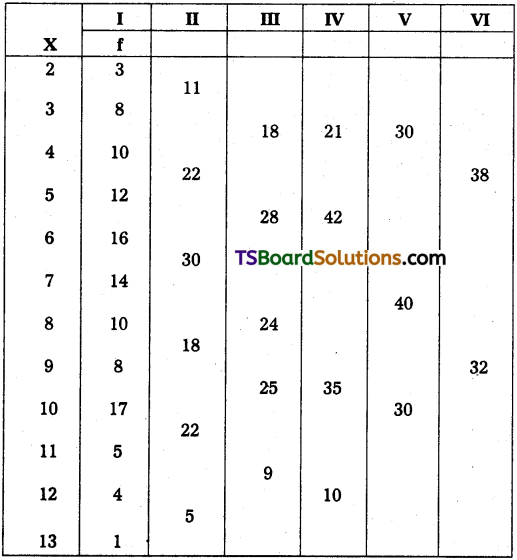
Analysis Table
∴ Z = 16
Question 6.
What is Arithmetic mean? What are its merits and drawbacks?
Answer:
Arithmetic Mean (\(\overline{\mathrm{X}}\)) :
Among all types of averages, the arithmetic mean or simple mean is most commonly and widely used measure of central tendency. It is normally expressed as “the sum total of the observations divided by the number of items observed”. It is defined as the quotient of the sum of all items or entries divided by the number of items.
1. Computation of Arithmetic Mean – Individual Series – Direct Method:
![]()
Where, \(\overline{\mathrm{X}}\) = Arithmetic mean, ∑X = Sum total of ‘X’, and
N = Number of items of ‘X’.
Merits and Drawbacks of Arithmetic Mean :
i) Merits of A.M.:
- It can be easily calculated; and can be easily understood.
- As every item is taken into calculation, it is affected by every item.
- As the mathematical formula is rigid one, therefore, the result remains the same.
- It is useful for further algebraic treatment.
- It is mostly used for comparing the various issues.
ii) Drawbacks of A.M :
- It cannot be located graphically.
- A single item can bring a big change in the result. For example, if there are three terms 3, 6, 9; the A.M. value is 6. If we add a new term 82, the new AM. value is 3 + 6 + 9 + 82 / 4 = 25. This a big change as compared to the size of first three terms of X.
- The A.M. gives greater importance to higher items of a series and lesser importance to smaller items.
- It cannot be located by inspection as in the case of mode and median.
- Sometimes it gives absurd results. For instance, if we have to find out.the number of children per family and if we get the average value as 4.3 children, obviously the result is absurd adn it can’t be in fractional value. A
![]()
Question 7.
What is median? What are it’s merits and drawbacks?
Answer:
Median (M):
Median is the middle element when the data set is arranged in order of the magnitude. Median is that positional value of the variable which divides the distribution into two equal parts. In the ungrouped data, the median is computed as follows :
- The values of the variate are arranged either in ascending or in descending order.
- The middle – most value is taken as the median.
If the number of values ‘n’ in the raw data is odd, then the Median will be the (\(\frac{n+1}{2}\))th value arranged in order of magnitude. In this case, there will be one and only one value of Median. On the other hand, if n is even, and when the data arranged in order of magnitude, there will be two middle – most values, (\(\frac{n}{2}\))th and (\(\frac{n}{2}\)+1)th values. Median is the average of the \(\frac{n^{th}}{2}\) (\(\frac{n}{2}\)+1)th values.
Merits and Drawbacks of Median :
i) Merits of Median:
- It is rigidly defined.
- Even if the value of extreme item is much different from other values, it is not much affected by these values.
- It can be located graphically.
- It can be easily calculated and is also easy to understand.
ii) Drawbacks of Median:
- Even if the value of extreme items is too large, it does not affect too much, due to this reason, sometimes median does not remain the representative of the series.
- Median cannot be used for further algebraic treatment.
- In a continuous series it has to be interpolated.
- If the number of series is even, we can only make its estimate; as the A.M. of two middle terms is taken as Median.
Question 8.
What is mode? What are its merits and demerits?
Answer:
Mode (Z) :
Mode is the most frequently observed value in the data or an observation with the highest frequency is called the mode of the data. Mode is defined as that value in series which occurs most frequently. Mode is a point of maximum concentration on a scale of values, i.e., it is the most typical or most fashionable value of series.
Merits and Drawbacks of Mode:
i) Merits or uses of Mode :
- Mode is the term that occur most in the series hence, it is neither an isolated value like Median nor it is a value like mean that may not be there in the series.
- It is not affected by extreme values hence, is a good representative of the series.
- It can be found graphically also.
- For open end intervals it is not necessary to know the length of open intervals.
- It can also he used in case of quantitative phenomenon.
- With only just a single glance on data we can find its value. It is simplest.
- It is the most used average in day-to-day life, such as average marks of a class, average number of students in a section, average size of shoes, etc.
ii) Drawbacks of mode :
- Mode cannot be determined if the series is. bimodal or multimodal.
- Mode is based only on concentrated values; other values are not taken into account inspite of their big difference with the mode. In continuous series only the lengths of class intervals are considered.
- Mode is most affected by fluctuations of sampling.
- Mode is not so rigidly defined. Solving the problem by different methods we won’t get the same results as in case of mean.
- It is not capable of further algebraic treatment. It is impossible to find the combined mode of some series as in case of Mean.
- If the number of terms is too large, only then we can call it as the representative value.
![]()
Question 9.
What are the characteristics of a good average?
Answer:
Characteristics of goods average :
- It should be based on all the observations.
- It should be rigidly defined. It should be clearly defined. There should be no confusion about the meaning or description of an average.
- It should be capable of future algebaic treatment.
- It should not be unduly affected by extreme values. No item of the series should affect the average too much. If very large items unduly affect the average, then the average cannot represent the entire group.
- It should be easy to calculate and simple to understand.
- It should not be affected by variations of sampling.
Very Short Answer Questions
Question 1.
Discuss the importance of statistics for the study of economics. [Mar. ’16]
Answer:
Statistical analysis render valuable assistance in the understanding of the economic problems and the formulation of economic policy. Economic problems are capable of being expressed numerically. The nature of many economic problems like poverty, unemployment, rise in prices, volume of trade, output of manufacturing, mining, agriculture etc., cannot be analysed without the help of statistics.
Question 2.
What are the advantages of diagrams?
Answer:
Diagrams are used with great effectiveness in the presentation of all types of data.
The advantages of diagrams are as follows :
- A properly constructed diagram appeals to eye and mind.
- There is no need to have special mathematical knowledge.
- Data presentation becomes easier.
- It facilitates comparison.
- It improves memory power.
Question 3.
What is a Pie diagram? [Mar.’17, ’16]
Answer:
Pie – Diagram :
This diagram enables us to show the partitioning of total into component parts. It is also called a pie chart.
Question 4.
Explain the uses of sub divided bar diagrams.
Answer:
In a sub-divided bar diagram, the bar is sub-divided into various parts in proportion to the values given in the data and the whole bar represents the total. Such diagram is also called “component bar diagram”. Such a diagram shows total as well as various components.
Question 5.
Compute median for the following data. [Mar. ’17, ’16]
5, 7, 7,8,9,10,12,15 and 21
Solution:
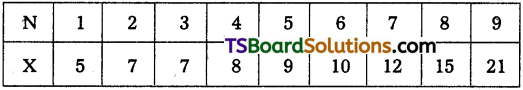
Here N = 9
Median = \(\frac{N+1}{2}\)
= \(\frac{9+1}{2}\) = \(\frac{10}{2}\)
5th value is 9.
Hence, Median (Q2) = 9
![]()
Question 6.
Explain the concept of Mode. [Mar. ’17]
Answer:
Mode is most frequently occuring value in data.
Question 7.
What are the uses of Arithmetic mean
Answer:
Uses of A.M.
- It can be easily calculated; and can be easily understood.
- As every item is taken into calculation, it is affected by every item.
- As the mathematical formula is rigid one, therefore, the result remains the same.
- It is useful for further algebraic treatment.
- It is mostly used for comparing the various issues.
Question 8.
Explain the concept of Geometric mean.
Answer:
Geometric mean (G.M.) :
The Geometric mean is a special type of average where we multiply the numbers together and then take a square root (for two numbers), cube root (for three numbers), fourth root (for four numbers) etc., and for ‘n’ numbers nth root (ty-). It is technically defined as ‘the nth root (\(\sqrt[n]{}\))product of ‘n’ numbers’. For instance, the geometric mean of two numbers, say 2 and 8, is the square root of their product, i.e., \(\sqrt{2.8}\) = 4. As another example, the geometric mean of three numbers, say 2, 3 and 6 is the cubic root of their product, i.e., \(\sqrt[3]{2.3.6}\) or (2.3.6)1/3 = 3.3.
Symbolically G.M. = \(\sqrt[n]{X_1,X_2,X_3……….X_n}\)
Where, G.M. = geometric mean; n = number of items and X = values of the variable.
Question 9.
What are the merits of Median?
Answer:
Merits of Median :
- It is rigidly defined.
- Even if the value of extreme item is much different from other values, it is not much affected by these values.
- It can be located graphically.
- It can be easily calculated and is also easy to understand.
Question 10.
What are the drawbacks of Median?
Answer:
Drawbacks of median :
- Even if the value of extreme items is too large, it does not affect too much, due to this reason, sometimes median does not remain the representative of the series.
- Median cannot be used for further algebraic treatment.
- In a continuous series it has to be interpolated.
- If the number of series is even, we can only make its estimate; as the A.M. of two middle terms is taken as Median.
Question 11.
Explain the merits of Mode.
Answer:
Merits:
- Mode is the term that occur most in the series hence, it is neither an isolated value like Median nor it is a value like mean that may not be there in the series.
- It is not affecteed by extreme values hence is a good representative of the series.
- It can be found graphically also.
- For open end intervals it is not necessary to know the length of open intervals.
- It can also be used in case of quantitative phenomenon.
- With only just a single glance on data we can find its value. It is simplest.
- It is the most used average in day-to-day life, such as average marks of a class, average number of students in a section, average size of shoes, etc.
Question 12.
Explain the drawback of Mode?
Answer:
Drawbacks of mode :
- Mode cannot be determined if the series is bimodal or multimodal.
- Mode is based only on concentrated values; other values are not taken into account inspite of their big difference with the mode. In continuous series only the lengths of class intervals are considered.
- Mode is most affected by fluctuation of sampling.
- Mode is not so rigidly defined. Solving the problem by different methods we wont get the same results as in case of mean.
- It is not capable of further algebraic treatment. It is impossible to find the combined mode of some series as in case of Mean.
- If the number of terms is too large, only then we can call it as the representative value.
Question 13.
Find the mode from the following data.

Answer:
From the given data, it can be seen that Rs. 480 occurred many times in the series.
∴ Mode = 480
![]()
Question 14.
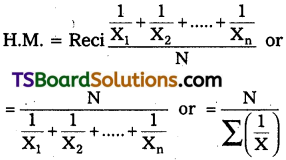
Explain the concept of Harmonic mean?
Answer:
Harmonic Mean (H.M.) :
The Harmonic mean of a series is the reciprocal or the arithmetic average of the reciprocal of the values of its various items. It can be calculated by using the following formula :
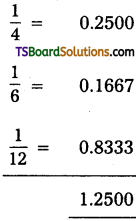
Question 15.
Compute Harmonic means for 4, 6 and 12.
Answer:
Harmonic mean for 4, 6, 12
| N | X |
| 1 | 4 |
| 2 | 6 |
| 3 | 12 |
∴ Reci procals (\(\frac{1}{x}\))
Question 16.
What is the Geometric mean of two numbers 4 and 16?
Answer:
Geometric mean of two numbers : 4, 16
| N | X |
| 1 | 4 |
| 2 | 16 |
N = 2
G.M. = \(\sqrt[n]{X_1.X_2.X_3}\) = (x1, x2 ………… x4)n
= \(\sqrt{4 \times 16}\) = \(\sqrt{64}\) = 8
Textual Examples
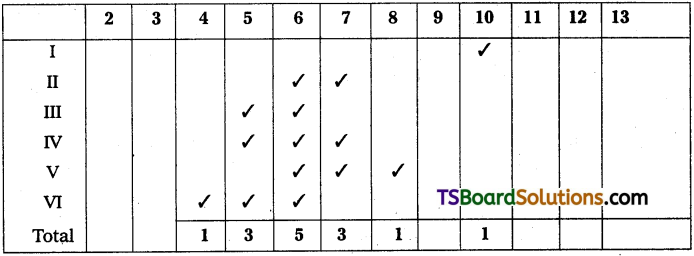
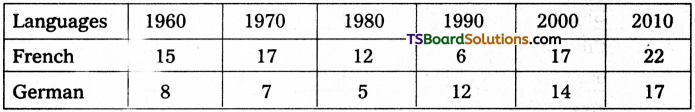
Qustion 1.
The following data relates to students studying foreign languages in a college.
Table-10.3 : Students Studying French & German in a College
Answer:
Question 2
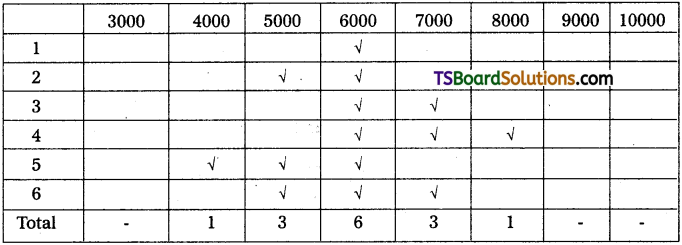
Draw the pie diagram for the following data.
Area of Crops Cultivated in a Year (in hectares)
Answer:
Total area = 16 + 24 + 10 + 8 + 5 = 63
Area changed into Degrees =
Question 3.
Following data relates to percentage of students going to school and out of school.
Table-10.4:Students Going to School and Out of School
| Particulars | Boys | Girls |
| School going | ||
| Children | 90 | 55 |
| Children out of School | 10 | 45 |
| Total | 100 | 100 |
Answer:
Question 4.
The following are the marks obtained by 6 students in a test. Calculate arithmetic mean.
Marks (X) : 70, 80, 40, 50, 65, 45
Answer:
| Sl.No. | X |
| 1 | 70 |
| 2 | 80 |
| 3 | 40 |
| 4 | 50 |
| 5 | 65 |
| 6 | 45 |
| N = 6 | ∑X = 350 |
\(\overline{\mathrm{X}}=\frac{\Sigma \mathrm{X}}{\mathrm{N}}=\frac{350}{6}\) = 58.3
∴ \(\overline{\mathrm{X}}\) = 58.3
![]()
Question 5.
Calculate arithmetic mean from the following data :
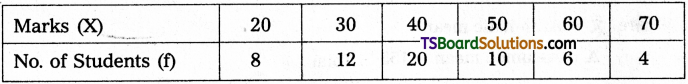
Answer:
Note : In the above example assumed mean is taken as 40,
Substituting the values the in the above formula,
= 40 + \(\frac{60}{60}\) = 40+1
∴ \(\overline{\mathrm{X}}\) = 41
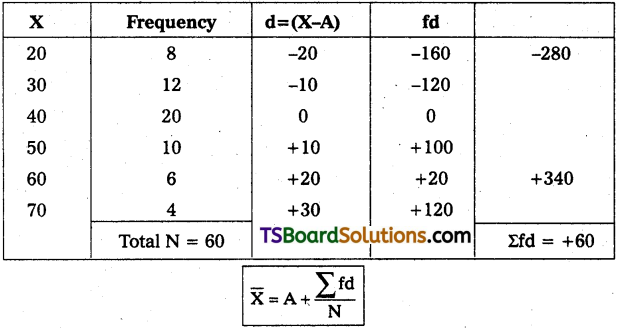
Question 6.
Find the arithmetic mean for the following data:

Answer:
Where, \(\overline{\mathrm{X}}\) = Arithmatic mean
A = Assumed mean =155
Question 7.
Calculate median for the below given data relating to income of seven persons.
Incomes (X): 100 150 80 90 160 200 140
Answer:
After arranging the given data in ascending order:
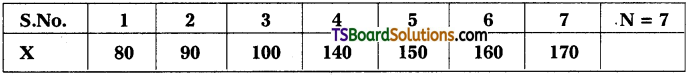
Med = (\(\frac{N+1}{2}\))th item
Where, Med = Median, N = Total no. of Items = 7
M = (\(\frac{7+1}{2}\))th item = \(\frac{8}{2}\) = 4th item
The corresponding ’X’ value of the 4th item in the series is 140 and
∴ Med = 140
Question 8.
Calculate median for the following data.
Answer:
| X | f | c.f |
| 10 | 5 | 5 |
| 20 | 8 | 13 |
| 30 | 12 | 25 |
| 40 | 20 | 45 |
| 50 | 30 | 75 |
| 60 | 16 | 91 |
| 70 | 10 | 101 |
| 80 | 7 | 108 |
| 90 | 8 | 116 |
| N = 116 |
Med (\(\frac{7+1}{2}\))th = item
Where, N = Total no. of frequencies = 116
Median = (\(\frac{116+1}{2}\))th item (\(\frac{117}{2}\)) = 58.5th item
58.5th item is included in the cumulative frequency of 75. Therefore, the corresponding X’ value is 50.
∴ Median = 50
![]()
Question 9.
Calculate median for the following data.
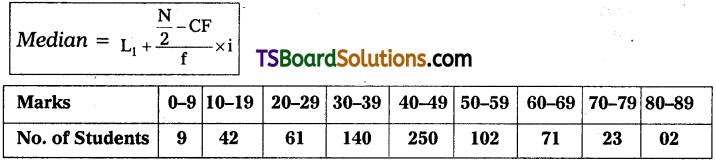
Note : When the data is given in ‘inclusive form’ (as the above), we have to change it into ‘exclusive from’. For that, we have to ‘subtract’ 0.5 from the lower limit of the class and ‘add’ 0.5 to the upper limit.
Answer:
| Marks (X) | f | c.f |
| – 0.5 – 9.5 | 9 | 9 |
| 9.5 – 19.5 | 42 | 51 |
| 19.5 – 29.5 | 61 | 112 |
| 29.5 – 39.5 | 140 | 252 = CF |
| 39.5 – 49.5 | 250 = f | 502 |
| 49.5 – 59.5 | 102 | 604 |
| 59.5 – 69.5 | 71 | 675 |
| 69.5 – 79.5 | 23 | 698 |
| 79.5 – 89.5 | 02 | 700 |
| N=700 |
Med = (\(\frac{N+1}{2}\))th item
Location of median class = (\(\frac{N}{2}\))th item = \(\frac{700}{2}\) = 350thitem
The 350th item is included in the cumulative frequency of 502. The corresponding class is the median class, i.e., 39.5 – 49.5.
Med = L1 \(\frac{\frac{N}{2}-C F}{f}\) × i
Where, Med = Median
L1 = Lower limit of the median class = 39.5, \(\frac{N}{2}\) = Median value = 350
CF = Cumulative frequency of the class preceeding to the median class = 252
F = Frequency of the median class = 250
![]()
Question 10.
Locate modal value for the below given data.
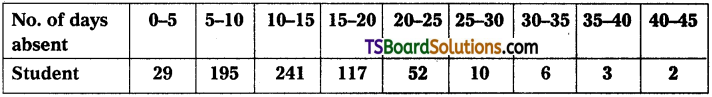
Solution:
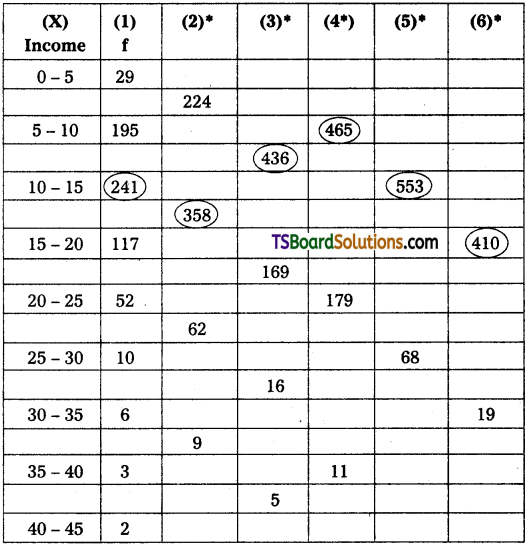
(2)* = figure arrived at by adding ‘f’ of two rows each.
(3)* = figure arrived at by adding ‘f’ of two rows each leaving first row.
(4)* = figure arrived at by adding ‘f’ of three rows each.
(5)* = figure arrived at by adding ‘f’ of three rows each leaving first row.
(6)* = figure arrived at by adding ‘f’ of three rows each leaving two row.
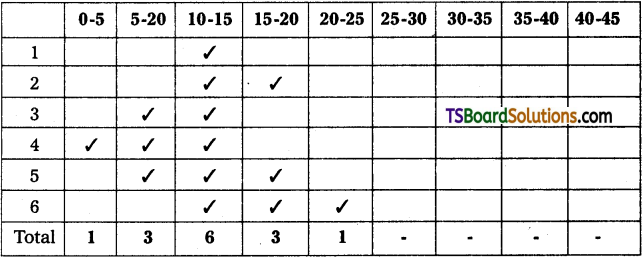
From the analysis table, it is found that 10 – 15 has modal class. So, the modal value lies in 10 – 15 class.
| Classes | Frequency (fi) |
| 0-5 | 29 |
| 5-10 | 195 f0 |
| 10-15 | 241 f1 Modal Class |
| 15-20 | 117 f2 |
| 20-25 | 52 |
| 25-30 | ,10 |
| 30-35 | 6 |
| 35-40 | 3 |
| 40-45 | 2 |
After grouping and analysis, the following formula is applied to determine modal value:
Z = L1 + \(\frac{\Delta_1}{\Delta_1+\Delta_2}\) × i
Where, Z = Mode = ?
L1 = Lower limit of the median class = 0
f0 = Frequency for the class proceeding to the modal class = 195
f1 = Frequency of the modal class = 241
f2 = Frequency of the class after the modal class =117
i = Size of the class interval = 5
∆1 = f1 – f0 = 241 – 195 = 46
∆2 = f1 – f2 = 241 – 117 = 124
After substituting the values in the above formula, we get
= 10 + \(\frac{46}{46+124}\) × 5
= 10 + \(\frac{230}{170}\) = 10 + 1.35 = 11.35
∴ Z = 11.35