TS Inter 1st Year Environmental Education Study Material Chapter 5 Effects of Industrial Development

Telangana TSBIE TS Inter 1st Year Environmental Education Study Material 5th Lesson Effects of Industrial Development Textbook Questions and Answers.

TS Inter 1st Year Environmental Education Study Material 5th Lesson Effects of Industrial Development

Esssay Questions

Question 1.
Write an essay on pollution in terms of Industrial Development. List out the reasons why pollution control measures are difficult to implement.
Answer:
The Dark side of Industrial Development :
The Industrial Revolution in the eighteenth century marked the beginning of the mass production of goods. As technology developed, factories multiplied exponentially. Prior to industrialization, there were only small factories or cottage industries, often run by small families. Factories were few in number and working hours were limited. By and the environment was clean.

In order to provide for the daily needs of the growing population, different types of industries have now been established. These industries use raw materials, process them and produce finished products. Besides the finished products, a good number of by products are produced. If the processing of waste is a cost prohibitive one, then the industrialist is often tempted to throw the waste matter into the environment instead of disposing it in a responsible manner. The waste may be in the form of gas, liquid or solid. The gases are usually released into the atmosphere, the liquids are discharged into aquatic bodies like canals, rivers or seas and solid wastes are either dumped on the land or in aquatic bodies.

In all the cases, the air, water or land is fouled due to the dumping of wastes. The fouling of the environment because of industrialization is referred to as ‘industrial pollution’. It is the undesirable outcome when factories or other industrial plants emit harmful by-products and waste into the environment. Emission of toxic chemicals into the atmosphere causes air pollution. Effluents released into water bodies cause water pollution. When soil is degraded by harmful substances, it is called soil pollution.

The Central Pollution Control Board, India has identified 17 industries which cause the most pollution. They include industries pertaining to fertilizers, pesticides, and pharmaceuticals, apart from petroleum refineries and steel plants.

Air Pollution :
Due to industrial activities, a variety of poisonous gases and substances like carbon dioxide, sulphur dioxide and dusts are spewed into the atmosphere, causing acute pollution. The quality of the air is vitiated also by the large number of autgmobiles which emit toxic fumes and particulate matter. The .burning of crop stubble, common in states like Punjab and Haryana, is another major cause of air pollution, especially in winter. Delhi is covered with thick smog and a “toxic cloud” at such times. The presence of pollutants in the air disturbs the natural eco-system. It affects the well-being and health of all living organisms, including human beings, animals and plants.

Water Pollution :
Effluents released by industries into water bodies contain harmful pollutants like lead, mercury and petro-chemicals. These pollutants contaminate the water of lakes, ponds, rivers and seas. Aquatic plants and animals are adversely affected. The improper disposal of sewerage and the seepage of industrial effluents into the soil results in the contamination of groundwater. The water becomes unfit for human consumption as it contains harmful compounds and also disease causing pathogens.

Hussain Sagar Lake, once the pride of Hyderabad is now choked with agricultural waste, pharma residues, municipal sewage, and industrial effluents. The Ganga has now become the 6th most polluted river in the world. Numerous tanneries, textile mills, and chemical plants discharge untreated waste into it everyday. Besides, about 3 billion litres of untreated sewage are dumped into the river daily. The National Mission to Clean Ganga aims to clean the Ganga and its tributaries in a comprehensive manner.
TS Inter 1st Year Environmental Education Study Material Chapter 5 Ill Effects of Industrial Development 1

Soil / Land Pollution :
Soil Pollution is defined as the presence of toxic chemicals in soil, in high enough concentrations to pose a risk to human health and/ or the ecosystem. Pesticides and chemical fertilizers used by farmers contain harmful compounds that contaminate the soil and are harmful when ingested by human beings or animals. Effluents and sludge discharged by industries pollute not only water bodies but land too.

Why Pollution Control Measures are Difficult to Implement :
In developing and under developed countries Pollution Control measures are difficult to implement because of the following reasons :

Lack of Policies to Control Pollution :
Lack of effective policies and poor enforcement of laws framed by the Pollution Control Board has resulted in unchecked pollution.

Use of Outdated Technologies :
Many industries still rely on old technologies so that they can avoid the high cost of incorporating new technology. These industries continue to generate large amounts of toxic waste.

Unplanned Industrial Growth :
Many industries have expanded in a haphazard and unplanned manner Owners of these industries may flout rules and norms pertaining to pollution control as it may not be economically feasible or profitable to do so.

Presence of Large Number of Small Scale Industries :
Many small-scale industries and factories that do not have enough capital rely on government grants to run their day-to-day businesses. They may not fall under the ambit of stringent environment regulations.

Inefficient Waste Disposal :
Water pollution and soil pollution are often the consequence of inefficient disposal of waste.

TS Inter 1st Year Environmental Education Study Material Chapter 5 Ill Effects of Industrial Development

Question 2.
List out the impact of Industrial Development and other human activities on the environment and the need for sustainable development.
Answer:
Since 1950 urban populations have increased seven-fold, energy use has soared five times, while the amount of fertiliser used is now eight times higher. Human activities are responsible for causing environmental degradation. The deterioration of the environment is manifested in many ways such as the depletion of resources like air, water and soil: the destruction of ecosystems; habitat destruction; the extinction of wildlife; and pollution.
TS Inter 1st Year Environmental Education Study Material Chapter 5 Ill Effects of Industrial Development 2

The table below highlights the impact of development on the environment.

Adverse Impact of Development on The Environment

Developments/Human Activities in the Modem AgeImpact on the Environment
Urbanization and Population Explosion
TS Inter 1st Year Environmental Education Study Material Chapter 5 Ill Effects of Industrial Development 3
• Deforestation/ Loss of billions of forest trees.
• Forest areas are converted to farm lands/ residential townships.
• Depletion of available natural resources.
• Decrease in rainfall.
• Increase in global temperature/ global warming affecting humans and also animals like the polar bear.
• Changes in climatic conditions.
• Increase in natural calamities like floods, earthquakes and droughts.
• Loss of wild life – tigers, elephants, snakes etc.
• Extinction of several plant species.
Developments/Human Activities in the Modem AgeImpact on the Environment
Industrialization and Mining
TS Inter 1st Year Environmental Education Study Material Chapter 5 Ill Effects of Industrial Development 4
• Loss of raw materials like wood, ores and minerals.
• Discharge of effluents/by products into the air. water and soil, thereby causing severe pollution. Water pollution – causes diseases like cholera and cancer, affects marine life. Air pollution – causes respiratory diseases, including cancer, vitiates the quality of air.
• Fertility of soil is affected.
• Loss of massive tracts of land, affecting crop production.
Commercial fishing
TS Inter 1st Year Environmental Education Study Material Chapter 5 Ill Effects of Industrial Development 5
• Disturbance to the ecosystem, ecological imbalance, disruption of the food chain.
• Threat of extinction of aquatic animals such as tunas and sharks.
• Destruction of coral reefs.
Commercial Agriculture and Livestock Farming
TS Inter 1st Year Environmental Education Study Material Chapter 5 Ill Effects of Industrial Development 6
• Deforestation due to plantation crops, burn and slash agriculture, grazing of livestock.
• Chemical pesticides and fertilizers used in commercial agriculture are toxic.
• Livestock (farm animals like cows and sheep) accounts for 40% of global emissions of gases like methane which contribute to global warming.
Tourism
TS Inter 1st Year Environmental Education Study Material Chapter 5 Ill Effects of Industrial Development 7
• Loss of forest land.
• Pollution of the natural resources due to construction of hotels, tourist influx, usage of plastic.
• Disturbance to the ecosystem.
• Threat to wild life.
Developments/Human Activities in the Modem AgeImpact on the Environment
Production & disposal of waste
TS Inter 1st Year Environmental Education Study Material Chapter 5 Ill Effects of Industrial Development 8
• Waste material, such as sewage, either in solid or liquid or gaseous form, is toxic and poses a health hazard.
• Improper disposal and dumping of garbage in cities leads to unhygienic conditions and spread of diseases. In Hyderabad alone, about 4500 tons of garbage is collected every day, of which only 30% is recycled.
Killing of Wild Life for trade
TS Inter 1st Year Environmental Education Study Material Chapter 5 Ill Effects of Industrial Development 9
• Unchecked poaching has led to several species of animals becoming extinct. For eg. elephants are killed for their ivory tusks, rhinos for their horns, antelopes for fur, sharks and gorillas for meat, tigers for their skin and for other organs which are believed to have medicinal properties.
Transportation
TS Inter 1st Year Environmental Education Study Material Chapter 5 Ill Effects of Industrial Development 10
• Particulate matter (PM) emitted by vehicles causes smog, respiratory diseases, cancer.
• Noise pollution caused by vehicles and jets affects the nervous system; hearing is impaired.

The Cost of Development :
Developed countries are generally highly industrialized and are technologically far more advanced than developing or under developed countries. The per capita income of the citizens in developed countries is very high and the people living there enjoy high standards of living. Thus, a country is deemed to be ‘advanced’ if it is dotted with skyscrapers, industries and express highways, and its citizens drive fancy SUVs and use all the latest technological gadgets.

But at what cost does such development take place? In his quest for Development, man is ruthlessly destroying the environment. It is estimated that for paper alone, about 4 billion trees are cut worldwide every year. Every”day, more than 2 million tons of sewage and industrial and agricultural waste are discharged into the world’s water, the equivalent of the weight of the entire human population. Deforestation, industrialization and population explosion have wreaked havoc on Nature. Glaciers are melting and groundwater aquifers are running dry. Weather patterns are changing worldwide and thousands of species of animals and plants are becoming extinct.

Man cannot escape the consequences of his actions. Global warming has not only made many places inhospitable for a living but has also affected crop production and led to an increase in natural calamities. Hoods, droughts, and earthquakes have become common throughout the world. Natural resources like water are rapidly becoming scarce. Recently Cape Town, the 2nd most populous city in South Africa, faced a major water crisis and narrowly escaped Day Zero, the day it was expected to completely run out of water. Cities like Bangalore, Moscow, and London are predicted to meet a similar fate.

The Need for Sustainable Development:
If Man wishes to survive on this planet, it is clear that he must live in harmony with the environment and stop the indiscriminate destruction of natural resources. He must strike a balance between his desire to improve the quality of his life and the preservation of the environment. Over-exploitation of the environment for economic profits will inevitably lead to a tipping point where natural resources can no longer be replenished at the place where they are being depleted.

The United Nations Conference on Environment and Development (UNCED) defines the concept of Sustainable Development. Sustainable Development is a development that meets the needs of the present generation without compromising the ability of future generations to fulfill their own needs. Sustainable development rests on three pillars – Environment, Economy, and Social Equity. If one of the pillars is weak, the system will collapse. Economic Sustainability ensures that the greed to make profits is curbed and that the environment is not damaged. Social Equity envisages the just and equitable sharing of resources among the rich and the poor, whether on an individual or global level. These pillars are also referred to as the 3 Ps- People, Profit, and Planet.
TS Inter 1st Year Environmental Education Study Material Chapter 5 Ill Effects of Industrial Development 11

TS Inter 1st Year Environmental Education Study Material Chapter 4 Factors Affecting Development

Telangana TSBIE TS Inter 1st Year Environmental Education Study Material 4th Lesson Factors Affecting Development Textbook Questions and Answers.

TS Inter 1st Year Environmental Education Study Material 4th Lesson Factors Affecting Development

Essay Questions

Question 1.
Define “Environment and Development”. Describe factors affecting development.
Answer:
‘Environment’ is a broad term and conveys different .meanings in different disciplines. In Natural Sciences, Environment is defined as a system which provides natural surroundings for the existence of organisms (including humans) and which is a prerequisite for their evolution. Abiotic components (e.g. : air, water, sunlight, minerals) and biotic components (e.g. : humans, animals, birds, insects) are the main elements of the environment. They are interlinked individually and collectively in myriad ways.

What is Development?
Development is the process of improving the quality of all human lives in three equally important aspects. These are

  • Raising the standards of living i.e. income and consumption, levels of food, medical services and education through relevant growth processes.
  • Creating conditions conducive to the growth of selfesteem through the establishment of social, political and economic systems and institutions which promote human dignify and respect.
  • Increasing the freedom to choose by enlarging the range of choice variables, e.g. : varieties of goods and services.

Thus, development is not purely an economic phenomenon but rather a multidimensional process involving reorganization and reorientation of the entire economic and social system.

Factors Affecting Development :
1. Physical Factors :
The physical environment and natural geographic features of a region have a direct impact on the kind of development that takes place there. For instance, the type of soil and the fertility of the soil at a place, proximity to rivers, as well as the climate and weather patterns determine whether agriculture is feasible there and, if so, what kind of crops can be grown. Factories are setup in areas which have an abundance of natural resources like wood and water or where there are rich deposits of minerals and ores. Hilly areas which enjoy a salubrious climate are developed as places of tourist interest. Kodaicanal, Ooty and Nainital are popular summer resorts bemuse of their picturesque surroundings and cool climate.
TS Inter 1st Year Environmental Education Study Material Chapter 4 Factors Affecting Development

2. Economic Factors :
The economic health of a region and the development that takes place there are inter dependent. If the economy thrives, there is a greater scope for developmental activities. More industries can be set up, infrastructure like roads, schools, hospitals and railway stations can be improved and better facilities are provided to the residents. These developmental activities, in turn, stoke the economy and attract more investment.

In order to attract foreign investments, the Government of India has facilitated the setting up of several Special Economic Zones (SEZ) in various states. Business units that setup establishments in a SEZ are entitled to several incentives and a simplified operating environment. Besides, no license is required for imports.

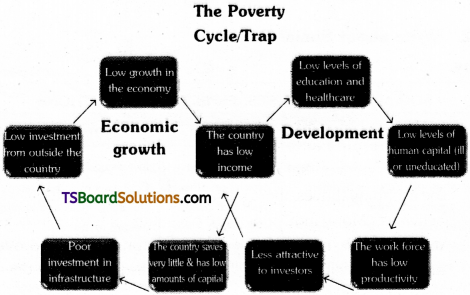
The figure below shows the Poverty Trap, which is often thought of as a cycle. Low investment in key areas such as infrastructure (roads, rail, telecommunications etc.), education and healthcare can have dire consequences for a population. Populations in countries hovering at low levels of development can become more vulnerable to ill health, as seen with regard to HIV and AIDs in sub-Saharan Africa. This, in turn, reduces the productivity of the workforce. In addition, lack of education leads to a lower quality work force, while poor road networks discourage investors.
TS Inter 1st Year Environmental Education Study Material Chapter 4 Factors Affecting Development 2

3. Social Factors :
There are many social factors that affect the level of development of a place. It is easier to execute developmental projects in a society that extols hard work and gives recognition to merit. Conversely, lack of social motivation for betterment, unproductive social activities such as war and having to provide for very large families are factors which hinder development. Negative socio-cultural practices such as gambling and drinking, and lack of skills due to poor training and education are other factors which impede development.

India is making rapid strides in many fields but it is still bogged down by various social evils such as the prevalence of the caste system, child labour, illiteracy, gender inequality, superstitions, and religious conflicts. These social ills are stumbling blocks in the path of national development.

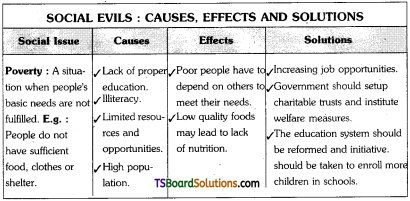
The causes and effects of these social ills are given below, along with solutions for their eradication. It is only when these social ills are eradicated that the country can truly develop in all spheres of life.

TS Inter 1st Year Environmental Education Study Material Chapter 4 Factors Affecting Development

Question 2.
Write about Social Evils.
Answer:
TS Inter 1st Year Environmental Education Study Material Chapter 4 Factors Affecting Development 3
TS Inter 1st Year Environmental Education Study Material Chapter 4 Factors Affecting Development 4
TS Inter 1st Year Environmental Education Study Material Chapter 4 Factors Affecting Development 5

TS Inter 1st Year Environmental Education Study Material Chapter 3 Population Explosion and its Consequences

Telangana TSBIE TS Inter 1st Year Environmental Education Study Material 3rd Lesson Population Explosion and its Consequences Textbook Questions and Answers.

TS Inter 1st Year Environmental Education Study Material 3rd Lesson Population Explosion and its Consequences

Easy Questions

Question 1.
What is population? Write briefly about population explosion and causes of population explosion.
Answer:
Introduction :
Population is a group of individuals of a particular species, sharing a common gene pool and occupying a particular area at a specific time.

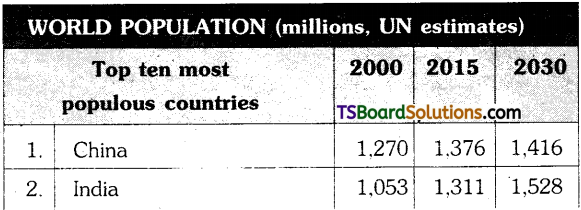
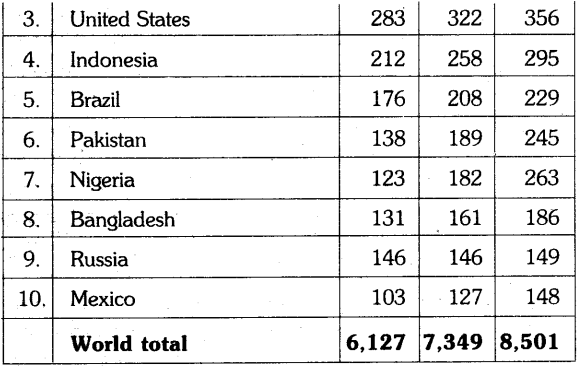
Population Explosion refers to the sudden and rapid rise in the size of population, especially human population. A drastic growth in population beyond normal limits is called population explosion. Population explosion is a global phenomenon but is more prominent in under developed and developing countries. The population of the world currently (May 2018) is about 7.6 billion. While China is the most populous country with over 1.38 billion inhabitants, it is predicted that India will overtake China by 2025. India and China together account for about 37% of the world’s population, Given below is a list of the world’s most populous countries along with projected figures for 2030.
TS Inter 1st Year Environmental Education Study Material Chapter 1 Man and Environment 13
TS Inter 1st Year Environmental Education Study Material Chapter 1 Man and Environment 14

The causes of population explosion are as follows :
a) Accelerating Birth rate / High Fertility rate :
The Fertility rate of a country refers to the number of children a woman gives birth to during her child bearing age. High fertility rates lead to a rapid increase in the population of a country. High fertility rates are prevalent in countries which are underdeveloped and where literacy rates, especially among women, are low. It is not a coincidence that 9 out of the 10 top countries with the highest fertility rates are in Africa, a continent in which the inhabitants of several regions routinely face abject poverty, starvation, famine, drought and disease, besides internal strife. Nigeria, a country in Africa, has the world’s highest fertility rate. On an average, women in Niger give birth to 7 children each. In India, the fertility rate is 2.2. Bihar, one of the most backward states, has the highest fertility rate of 3.34. Telangana has a fertility rate of 1.78.

b) Decrease in Infant Mortality Rate :
Infant Mortality Rate refers to the number of deaths of infants under 1 year old per 1000 live births. An improvement in medical science and technology, better maternal care facilities and wide usage of preventive drugs (vaccines) has reduced infant mortality rates in many countries, including India. 1MR is an index of the health of a country. Monaco, Japan, Iceland and Singapore are countries with an IMR of less than 2.5. The IMR in India (as>in 2016) is 34.

c) Increase in life expectancy :
Due to improved living conditions, better hygiene and sanitation habits, better nutrition, health and education, the average life expectancy of human population has improved significantly. Steady supply of good quality food, makes sure that the population is well nourished. Population grows when they are adequately nourished. Japan, Switzerland and Singapore have the highest life expectancies in the world, with an average life expectancy of about 83 years. The life expect^npy in India is about 68 years (as in 2015).
TS Inter 1st Year Environmental Education Study Material Chapter 1 Man and Environment 15

d) Increased immigration :
An increase in immigration Often contributes towards population explosion, particularly in developed countries. It happens when a large number arrive at an already populated place with the intention to reside permanently.

e) Less space than required :
In urban cities, it is often found that there is very less scope for making available extra space to absorb the additional population. In such cases, a large population is seen packed into a smaller space.

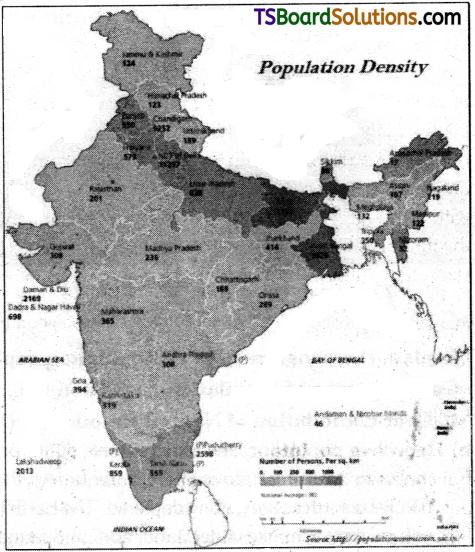
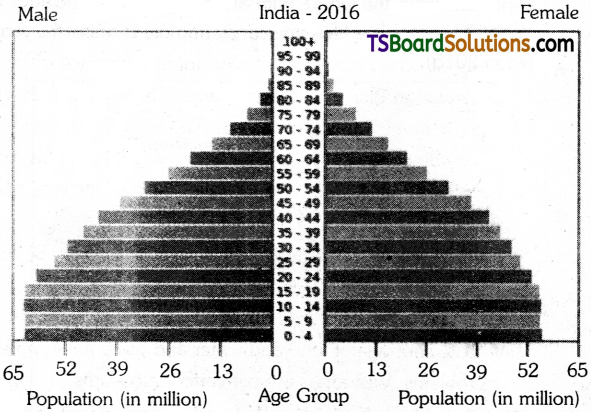
The details of the Indian population density and age distribution are given in the map :
TS Inter 1st Year Environmental Education Study Material Chapter 1 Man and Environment 16

TS Inter 1st Year Environmental Education Study Material Chapter 3 Population Explosion and its Consequences

Question 2.
Explain the consequences of population explosion.
Answer:
Consequences of Population Explosion :
i) Over Exploitation of Natural Resources :
Due to high growth in population, the requirements of the people have increased at a tremendous rate. Consequently, the available natural resources are getting depleted. The Earth has limited natural resources like water, land, flora and fauna, minerals and fossil fuels. Over-exploitation has created a severe depletion of resources. Humans today extract and use around 50% more natural resources than they did just 30 years ago. It is estimated that within 40 years, the reserves of petroleum will vanish completely. Water scarcity is rampant and it is common for states to be engaged in bitter disputes about their rightful share of water.

ii) Industrialization and Urbanization :
Urbanization is the result of growth of population in urban areas. As a country develops from primarily an agricultural to an industrial economy, large – scale emigration of rural residents to towns and cities takes place. During the process, the growth rate of urban areas is typically double the pace of overall population increase. Urbanization is taking place at a fast rate in India. The population residing in urban areas in India, according to the 1901 census, was 11.4%. This count increased to 28.53% according to the 2001 census, and in 2018 it stands at 33.2%.

Urbanization eventually leads to a severe decline in the number of people living in the countryside, with negative population growth rates in rural areas. Urban areas face acute shortage of land and water and other environmental problems. Vast areas are converted into slums.

iii) Shrinking Agricultural Land :
Agricultural lands are being converted into residential settlements and industrial zones. The per capita availability of land for cultivation declined by nearly 50% from 1.1 acres in 1911 to 0.6 acres in 1971 in India. Since then it has shrunk much further. The small size of holding hinders adoption of modem technology in farming.

iv) Global Wanning :
Population explosion is linked with global warming. The increase in population leads to greater consumption of resources. The amount of carbon dioxide and other greenhouse gases that is produced increases. This causes a rise in global temperatures. The global average surface temperature has increased during the 20th century by about 0.6°C. If it rises further, the consequences will be disastrous.

v) Environmental Pollution :
The tremendous growth in population has led to the degradation of the environment. Air, water and soil have got contaminated with various pollutants.

vi) Poverty, Malnutrition and Famine :
Millions of people live in hunger and suffer from malnourishment because they cannot afford to buy enough food, cannot afford nutritions food or cannot afford the arming supplies they need to grow enough good food of their own.
TS Inter 1st Year Environmental Education Study Material Chapter 1 Man and Environment 17

Poverty and malnutrition are a common phenomenon in underdeveloped countries. Africa, which has the highest population growth rate, is also the world’s poorest continent. Countries in Sub-Saharan Africa suffer from frequent droughts and famines and have high rates of starvation deaths.

vii) Population reduces the Rate of Capital Formation :
In underdeveloped countries, due to high birth rates and low life expectancy, the number of dependents in families is high. Nearly 40 to 50 per cent of the population is in the non-productive age group, which simply consumes and does not produce anything. The per capita income is low because the dependents have to be fed and taken care of. Job opportunities too are less in poor countries. Thus, there is very little scope for savings or capital formation.

viii) Population growth weakens Social Infrastructure :
In welfare states like India, the government pledges to meet the social needs of the people by providing basic facilities like free or subsidised education, housing and medical aid. But the vast increase in population casts a heavy burden on the government and details many plans.

TS Inter 1st Year Environmental Education Study Material Chapter 3 Population Explosion and its Consequences

Question 3.
Explain population control measures or initiatives in India.
Answer:
Population Control Measures / Initiatives in India :
There are no easy solutions to the problem of population explosion. Population growth is inextricably linked with factors like poverty and illiteracy. It is only when people are educated and enjoy reasonably good standards of living that the population of a country will stabilize. It is not a coincidence that countries like Norway, Switzerland, Singapore and the U.S.A which have a high Human Development Index have a low growth rate of population. In India, economically backward states like Bihar, U.P and Rajasthan have the highest birth rates. A multipronged effort is needed, therefore, to tackle the problem of population explosion.

In countries like India, societal norms and prejudices influence the size of families. The preference for a male child, prevalence of child marriages and the low status accorded to women in many communities are some factors which contribute to high birth rates.

India was the first country in the world to launch a nation wide Family Planning programme in 1952. Government agencies and institutions were mobilized to spread the message of the importance of having small families. The media was extensively used for propaganda. People were reminded of the advantages of small families. It was pointed out that children in such families would be healthy and happy as parents could devote more time and resources to them. Cheap contraceptives were distributed in even the most remote villages, sex education was popularized, sterilizations were conducted and aborption was legalized. Couples were persuaded to go in for sterilization after the birth of two children.

Every country must devise its own ways to tackle the menace of over population. In 1979, China started the ‘one child per family’ policy. Draconian measures were used to implement the law. Those who defied the law and had a second child were subjected to brutal punishment. The child too bore the brunt as the government denied him/her education and health care. The infamous population control measure was successful in bringing down the birthrate but at the cost of gross human rights violations. Such coercive tactics to enforce birth control are abhorrent and are ill-suited for a democratic country like India.

Measures to Control Population :

  1. The government should regularly conduct programmes to educate the public about the ills of over population.
  2. Social organizations and NGOs should actively inform people about the available methods of family planning.
  3. People should be persuaded, but not coerced, to undergo sterilization after having two children.
  4. Female literacy should be encouraged so that women can take informed decisions about the size of their families.
  5. The ban on child marriages should be enforced strictly.
  6. Maternal and childcare facilities should be improved.

Are there any advantages of High Population Growth?
An increase in the rate of population growth is not devoid of advantages. The teeming population of youth in developing countries like India can play a vital role in building the economy. Their strength and talents can be harnessed in various ways. In contrast, advanced countries like Japan and many European countries face peculiar problems associated with a sharp decline in population. Japan has become a society of aging people because of a rapid fall in fertility rates and an increase in longevity. Nearly a quarter of the population is above 65 years. Because of a shrinking labour force, dependence on robots is increasing, both at home and in factories. There is no one to take care of the elderly population.

TS Inter 1st Year Environmental Education Study Material Chapter 2 Environmental Stakeholders

Telangana TSBIE TS Inter 1st Year Environmental Education Study Material 2nd Lesson Environmental Stakeholders Textbook Questions and Answers.

TS Inter 1st Year Environmental Education Study Material 2nd Lesson Environmental Stakeholders

Essay Questions

Question 1.
Write about Environmental stakeholders.
Answer:
Stakeholders are defined as the people and organizations who are likely to be affected, either directly or indirectly, by an action or policy of the government or by the action of an industry or organization. Stakeholders have a vested interest in something and are likely to gain or loss on account of any changes initiated by others or by their own intervention.

In the environmental context all citizens are stakeholders as they are directly or indirectly affected by developmental activities which alter the water, air and soil around them. When industries are setup in a town, the economy picks up, jobs are created and infrastructure improves. Many residents reap the benefits. These people derive some advantages and are affected favourably by the environmental decision. At the same time, however, the residents may suffer from ill effects of industrialization. The factories may discharge pollutants into the air and water, thereby harming the health of the people. The pollutants released may cause water bodies to become a breeding place for vectors like mosquitoes which spread diseases. The water bodies may also emit a foul odour due to the release of gases like hydrogen sulphide and ammonia. The residents, therefore, may also suffer adversely as a consequence of the environmental decision.

Similarly, when a dam is constructed, hydro – electricity is generated, providing clean energy to thousands of homes. Vast areas get irrigated, bringing cheer to farmers. But the same dam may submerge scores of villages, forcing the displacement of thousands of villagers. Thus, while some are benefitted by the project, others are adversely affected.

The stakeholders in projects affecting the environment include government representatives, businesses, scientists, land owners, and local communities who are traditionally dependent on the nearby natural resources. The objectives of each of the groups vary and it is difficult to evolve a common agenda and uniformity while implementation of developmental projects. The United Nations Environment Programme identifies nine specific major stakeholder groups for sustainable development: Farmers, women, scientific and technological community, children and youth, indigenous peoples and their communities, workers and trade unions, business and industry, non-govern-mental organizations, and local authorities (UNEP 2015).

TS Inter 1st Year Environmental Education Study Material Chapter 1 Man and Environment

Question 2.
Describe the categories of stakeholders.
Answer:
Environment stakeholders can be broadly categorised into the following categories based on the cause-effect relationship and the management systems :

I. Affected parties :
The proposed projects, such as the setting up of an industry or a multipurpose project like a dam, may induce changes in the surrounding environment thereby affecting the health and socio-economic conditions of the residents in those areas. There may also be a cultural invasion (especially, impacting tribes who have a distinct culture of their own). The parties may be affected directly or indirectly.

a) Directly Affected Parties :
It involves a direct cause and effect due to the proposed changes in the surrounding. The effect may be a positive or negative one, leading to gain or loss on account of the proposed change.

i) Positive Affect :
This may be due to appreciation of the property or sub constracting and employment opportunities as a result of the proposed changes. The people who stand to gain are called Risk Gainers.

ii) Negative Affect :
The proposed project may lead to damage of the property, displacement leading to migration. The people who stand to lose are called Risk Losers.

b) Indirectly Affected Parties :
It involves an indirect effect due to the modifications induced into the surrounding environment. For instance, even people who reside in distant places may be indirectly affected by the discharge of pollutants and depletion of natural resources.

II. Project Proponents / Risk Perpetrators :
The proponents of a project or Risk Perpetrators are one of the major stakeholders. The proponent may be the government or an entrepreneur (firm / organization / private / public limited company / Individual) who is in the process of setting up an industry.

III. Regulatory Authorities or Committees / Risk Managers :
These are the statutory authorities who are connected with regulating and monitoring the implementation of the guidelines / rules. These authorities include regulatory bodies from central, state, and local govemments. The committees constituted by the government and the non – governmental organizations (NGO) and other civic bodies also play a vital role in representing the advocacy of the community to highlight issues and their redressal.

Of course, these categories are not mutually exclusive For example, a risk gainer might also be a risk loser. An affected person may benefit in some ways and lose in other ways. (e.g. : a person gets employment in a factory but is exposed to dust and smoke); a risk perpetrator is likely to be a gainer as well and may also be expected to be a risk manager, (an industrialist is interested in economic profits but also convinces the local community about the benefits of the project and tries to allay their apprehensions).

The involving of multiple stakeholders brings together individuals with different perspectives, interests and positions. The success of any project depends on the mutual co-operation among different stakeholders with clear information flow while imparting mutual trust and fulfilling the assurances. Sometimes this may have the potential to slow the implementation of a project and create conflict. Though, potential overlaps and ambiguities exist, the co-operation and interaction between different stakeholders will bring radically different perspectives and may lead to a better decision making process.

Question 3.
Explain “3 Rs” Approach.
Answer:
It is key for the success of any project / policy to identify and engage all the stakeholders right from the beginning of the project. The most basic stakeholder analysis involves identification of people, groups, and institutions that have some interest in a project or affected by it. The government or project proponents will undertake a stakeholder analysis prior to the planning and development of an environmental project. The objective of stakeholder analysis is to identify and assess the relevant view points of key people, groups or institutions on the proposed activity.

“3 Rs” Approach :
Rights, Risks, Responsibilities before assembling stakeholders, the project planners or meeting facilitators should consider acknowledging each stakeholder’s individual rights, risks, and responsibilities. The ”3 Rs” approach has been championed by the United Nations. In this approach, project planners acknowledge and characterize stakeholder :

  • Rights (e.g. : rights to extractable resources, rights of land tenure, human rights).
  • Risks associated with a project (e.g. : loss of reputation, economic loss, loss of cultural integrity).
  • Responsibilities in planning and executing the project (may be included in a formal agreement or contract).

Facilitating inclusive stakeholder engagement
Following a pre-planning stakeholder analysis, a project proposal is typically announced and stakeholders are invited to participate in the process.

Bringing stakeholders face to face is an important step of the engagement process. Discussion among stakeholders has been shown to help foster collaboration and the willingness to participate. Capacity development is another approach, which involves building the capacity of stakeholders to understand and solve the issue at hand and has been associated with successfully project outcomes. It can include training work-, shops, courses, or professional development for key stakeholder groups to provide them with the necessary knowledge, skills, and tools for more productive engagement.

Question 4.
Explain the benefits of stakeholder consultation process.
Answer:
Project Proponents :

  • The project proponent will benefit with the inputs obtained, during consultation process leading to better planning by incorporating the feedback.
  • The perspectives of local stakeholders can allow for solutions better suited for the social and cultural context of a region.
  • It takes into account a diversity of values and facilitating empowerment, trust and equity by including local communities in the decision making process and consensus can be arrived before a new rule, plan or decision takes effect.
  • This can lead to a more harmonious process and avoidance of unnecessary conflict ensuring smooth execution of the projects.

Affected Parties :

  • It reduces the marginalization of under-represented groups and provides an opportunity to the most impacted for expressing their concerns.
  • The stakeholder will feel the ownership and as a part of the system and can lead to increased support for smooth implementation of the project.
  • Another potential benefit of engagement from this perspective is social learning, where stakeholders can learn from each other and develop new relationships along the way.

Corporate Social Responsibility in India :
CSR is a concept, wherein an enterprise is accountable for its impact on all relevant stakeholders and includes the social and environmental considerations into a company’s operations. India is the first country in the world to make Corporate Social Responsibility (CSR) mandatory, following an amendment to the Company Act, 2013 in April 2014. It mandates the Businesses to invest 2% of its profits in areas such as education, poverty, gender equality and hunger.

TS Inter 1st Year Environmental Education Study Material Chapter 1 Man and Environment

Question 5.
Describe some case studies on the issue of stakeholder participation.
Answer:
1) The Singur-Tata Motors controversy is an apt illustration of the turmoil that ensures when the interests of stakeholders are not adequately taken into consideration. In 2006, the Tata group was granted permission by the government of West Bengal to setup their Tata Nano factory on 1000 acres of fertile, agricultural land in Singur. However, the project faced stiff resistance from displaced farmers who felt that they were losing their only source of livelihood and were not being given sufficient compensation in terms of money or jobs at the proposed factory.

The displaced farmers received massive support from the opposition party led by Mamata Banerjee as well as from environmentalists like Medha Patkar and Arundhati Roy. The project was called off in 2008 and was shifted to Gujarat where farmers received four times the market price for the land they gave up.
TS Inter 1st Year Environmental Education Study Material Chapter 1 Man and Environment 11

2) The Sterlite Copper Agitation in Thoothukudi, Tamilnadu, is another instance of the violent clashes that erupt when commercial interests of industrialists override environmental concerns and safety. Sterlite Copper started operations in Thoothukudi in 1997 after being driven out of Ratnagiri, Maharashtra due to environmental concerns. It was dogged by controversy and court cases right from the beginning. Residents complained of noxious gas leaks and poor effluent management for over two decades.

They suffered from chronic respiratory diseases and eye irritation. Environmentalists pointed out that the plant was too close to the ecologically sensitive region of the Gulf of Munnar, it had not created a sufficient green belt around the factory; that public hearings were not held before giving the plant a go-ahead; and pollutants like cadmium, copper, aluminium, lead and arsenic were seeping into the groundwater.

Things took a turn in March 2018 when Sterlite sought approval to build a second copper smelter. There were large scale protests by villagers, politicians and environmentalists. Film actor turned politician, Kamal Hassan, too joined the fray. Several people, including policemen, lost their lives in the agitation. The plant was finally shut down indefinitely in May 2018.

3) Land acquisition for Mumbai-Ahmedabad Bullet Train :
India’s ambitious Mumbai-Ahmedabad bullet train project costing $ 17 billion, expected to be constructed by August 2022, faced delays due to problems in land acquisition. It faced stiff resistance from farmers and tribal villages, especially in the Palghar district of Maharashtra. The National High Speed Rail Corporation Limited (NHSRCL) then took the initiative of involving women of 73 villages in Palghar district in the project. These women were entrusted with the task of facilitating communication between the village heads and NHSRCL engineers. Ateam of 15 women from various blocks was setup to explain the compensation packages being offered and the exact land requirement.

This method of stakeholder participation paid rich divi-dends. There is a participation change in the villagets. Till a few months ago, the survey teams could not even enter some of these areas! In Dahanu, for instance, where the project team even faced violence, officials have now been able to establish contact with all the 16 villages where land is required and were able to clear misgivings and lack of understanding about the project.

4) ‘Restore or Demolish’ : The Fading Glory of the Taj Mahal :
The Taj Trapezium case :
It is not merely displaced villagers, or farmers and fishermen who lose their source of livelihood, who are affected parties or risk losers. A concerned citizen too is a risk loser in the environmental context if he perceives a threat to his aesthetic enjoyment of a beautiful monument or a scenic place because of “developmental” activities. As a socially responsible citizen, he may be concerned about environmental issues that affect the general population.

In what is popularly referred to as the Taj Trapezium case’, Mr. M.C. Mehta, a casual visitor to the famed monument, was appalled by the damage caused to the structure by surrounding polluting industries. Being a Supreme Court lawyer, he filed a Public Interest Litigation in 1984. The case had far reaching consequences which are being felt to this day.

Located on the banks of the Yamuna in Agra, the Taj Mahal is considered one of the wonders of the modern world. The 17th century mausoleum, made entirely of ivory-white marble, was built, by the Mughal emperor, Shah Jahan. Thousands of visitors come daily from all parts of the globe to admire the beauty of this monument.
TS Inter 1st Year Environmental Education Study Material Chapter 1 Man and Environment 12

Over the last few decades, however, the Taj Mahal has been getting discoloured and pitted and is losing its pristine beauty. The cause of the yellow discolouration is by the high levels of air pollution in the surrounding areas. The un-checked growth of iron foundries, chemical industries and brick factories, as well as heavy vehicular traffic, have all contributed to the problem. The Mathura oil refinery and the glass factories at Ferozabad too are a major source of pollution. Most of these industries lie within a 10,400 sq km trapezium shaped area around the Taj.

Mr.Mehta’s PIL led to the formation of committees to study the problem in depth. Finally in 1996 the Supreme Court suggested that 292 polluting industries located within the Taj trapezium area be relocated in a phased manner, unless they stopped using coal and started using natural gas, instead. The Court applied the principle of Sustainable Development in this case, observing that there should be a balance between economic development and environmental protection.

The court reaffirmed the “Polluter Pays Principle”, whereby the polluter would be liable to compensate the individual sufferers as well as bear the costs of reversing the damage to the environment.

Unfortunately, however, the implementation of the measures has been tardy. Today Agra is the 5th most polluted city in India and the 27th most polluted city in the world. In anguish and exasperation the Supreme Court reprimanded the U.P. Government in July 2018 and served an ultimatum – restore the Taj Mahal or demolish it. Spurred to action, the government promised to prepare a 100 year vision document for the conservation of the Taj, including closing down of polluting industries and promoting green transport.

TS Inter 1st Year Environmental Education Study Material Chapter 1 Dimensions of the Environment

Telangana TSBIE TS Inter 1st Year Environmental Education Study Material 1st Lesson Dimensions of the Environment Textbook Questions and Answers.

TS Inter 1st Year Environmental Education Study Material 1st Lesson Dimensions of the Environment

Essay Questions

Question 1.
Explain the term “Environment”.
Answer:
Environment refers to the sum total of conditions which surround a living being’s habitation. It includes both biotic (living) and abiotic (non-living) aspects. The word ‘environment’ has been derived from the French word ‘environir’ which means ‘to surround.’ Environmental Studies is a multidisciplinary subject which systematically studies human interaction with the environment and seeks to find answers to problems such as how the growing population on earth can be sustained with the finite resources of Nature.
TS Inter 1st Year Environmental Education Study Material Chapter 1 Man and Environment

Man has had a close relationship with his environment since time immemorial. Primitive man lived in the lap of Nature and derived nourishment and sustenance from the bountiful resources of Nature in the form of the air he breathed, the water he drank, the food he ate and the trees and caves in which he sought shelter. Man’s needs were few and Nature seemed a perennial source and supplier of pristine resources.

However, rapid technological advancements and unchecked urbanization in the last few centuries have altered the relationship between Man and Nature in unimaginable ways. The everincreasing growth in population led to the depletion and degradation of the environment. Over – exploitation of natural resources in the last century has led to an unprecedented crisis and has raised concerns not only about the resource availability for future generations but the very existence of the human race.

TS Inter 1st Year Environmental Education Study Material Chapter 1 Man and Environment

Question 2.
Write the relationship between Man and Environment. What are the impacts of Man on Environment?
Answer:
Man – Environment relationship :
The relationship between Man and his Environment can be categorised into four broad stages if we examine the history of the socio-cultural evolution of man. The four stages are :

  1. Hunting and Food gathering.
  2. Animal domestication and Pastoralism.
  3. Agriculture.
  4. Industrialization.

i) Hunting and Food gathering :
The life of primitive man was nomadic and unstructured. Man was dependent on his surroundings for food and other needs.

• Primitive man :
a) Man was part of the natural environment.
b) He lived in harmony with the environment and completely depended on the natural resources and food available in his habitation.
c) Later he began to hunt animals for food.

• Discovery of fire, invention of tools :
a) The necessity of tools for hunting and the invention of fire radically changed the life of primitive man and paved the way for the exploitation of natural resources.

ii) Animal domestication and Pastoralism :
The next stage of evolution was the domestication of animals for meat and milk. This led to greater control on the environment and reduced dependence on natural resources alone.

iii) Agriculture :
During this stage man started cultivating crops. There was no further need to lead a nomadic life. He now had a permanent habitation and this, in turn, paved the way for community living and a gradual increase in human population. In subsequent years he started clearing the forests, not only for the purpose of gathering firewood, but for agricultural use as well as for the construction of dwellings.

iv) Industrialization :
The subsequent development of Science and Technology led to the Industrial revolution which began during the late eighteenth century in Great Britain. Goods started being produced on a mass scale in factories. This led, inevitably, in indiscriminate exploitation of natural resources and the fouling of the environment.

Impact of Man on Environment :
Various activities of man have left a profound impact on the environment. Some of the effects are direct while others are indirect.
Activities of Man that affect the Environment :

a) Land use changes :
• Clearing of forests, burning of land, felling of trees, changes in cropping patterns.

b) Agricultural practices ;
• Mechanization of agriculture, use of chemical fertilizers and pesticides.

c) Construction and Excavation :
• Construction of dams, roads and bridges; Mineral extraction by way of excavation; Urbanization.

d) Exploitation of Natural Resources :
• Excessive use of natural resources like wood and water
• Excessive use of conventional sources of energy like coal and fossil fuels.

Question 3.
Describe the Dimensions of the Environment.
Answer:
The Environment has three major dimensions. These dimensions have a mutual influence on each other and have a significant impact on the sustenance of life on this earth. The three dimensions are :
1) Physical 2) Biological 3) Social

The various sub-components in each of the three dimensions of the environment are given in the table below :

PhysicalBiologicalCultural
LithosphereFloraSocial
HydrosphereFaunaPolitical
AtmosphereMicrobesEconomical

I. The Physical Environment :
It comprises the abiotic components or non-living components of the environment such as land, air and water. These components are referred to as the lithosphere (land), atmosphere (air) and hydrosphere (water). Each of these physical components can be sub divided into different components based on their physical properties.

a) Lithosphere :
The word ‘lithosphere’ is derived from the Greek words ‘lithos’ (rock) and ‘spharia’ (globe or ball). The lithosphere includes the crust and the upper most mantle of the earth and constitutes the Biotic Environment. It is the solid part of the earth, made up of rocks and solids. The lithosphere occupies about 29% of the earth’s surface area and provides the habitat for flora (plants) and fauna (animals).
TS Inter 1st Year Environmental Education Study Material Chapter 1 Man and Environment 2

b) Atmosphere :
It is a layer of gases which surrounds the earth on all sides. The word ‘atmosphere’ is derived from the Greek words ‘atoms’ (vapour) and ‘sphaira’ (sphere).

The atmosphere of the earth is composed mainly of nitrogen (about 78%), oxygen (21%) and argon (0.9%). Carbon dioxide and other gases are found in traces.

The atmosphere plays a crucial role for the sustenance of life on the earth. Life, as we know it, would not be possible without the atmosphere. Oxygen is used by most organisms for respiration. Plants and animals need nitrogen to make proteins. Carbon dioxide is used by plants and algae for photosynthesis.

The atmosphere keeps us warm. It holds the surface heat on the earth and prevents it from radiating out into space. It reduces the extreme temperatures between day and night. The atmosphere also gives us weather. Wind, rain and snow depend on the atmosphere. Without winds and rain we would not have water to drink. Plants and animals too would perish. Apart from these functions, the atmosphere also helps to pro­tect living organisms from damage caused by harmful ultra violet radiation from the sun.
TS Inter 1st Year Environmental Education Study Material Chapter 1 Man and Environment 3

The atmosphere of the earth consists of a number of layers which differ in properties such as composition, temperature and pressure.

The lowest layer is the troposphere with extends from the surface of the earth to the bottom of the stratosphere. The stratosphere extends from the top of the troposphere to the bottom of the mesosphere and contains the ozone layer. The ozone layer ranges in altitude between 15-35 km where most of the U.V radiation from the sun is absorbed.

The top of the mesosphere ranges from 50-85 km. The thermosphere extends from 85 km to the base of the exosphere at 690 km and contains the ionosphere, a region where the atmosphere is ionised by incoming solar radiation.

c) Hydrosphere :
The hydrosphere (from Greek ‘hydr’ which means ‘water’) is the combined mass of water found on, under and above the surface of the earth. It includes the oceans, lakes and rivers, water vapour in the atmosphere, water in the soil, aquifers and glaciers. About 71% of the Earth’s surface is covered with water. The oceans hold about 96.5% of all the water on the Earth.

Saltwater accounts for 97.5% of water. Fresh water accounts for only 2.5%. Of this fresh water, about 30% is in the form of fresh gro jnd water and the rest exists as snow and ice on glaciers.

II. The Biological Environment or Biosphere :
The biosphere (from Greek ‘bios’ which means ‘life’) is also known as the ecosphere (from Greek ‘oikos’ which means ‘environment’). It is the worldwide sum of all ecosystems. It contains all forms of life including human, animal and plant life. Flora includes all plants in various forms such as forests, grasslands and other types of vegetation. Fauna refers to all animals and other organisms which live in the air, soil or water. The average thick-ness of the biosphere, consisting of those parts of the air, water, soil and rock where life exists in some form, is about 25 km.
TS Inter 1st Year Environmental Education Study Material Chapter 1 Man and Environment 4

It is difficult to pinpoint the exact time the biosphere came into existence as records of primitive living forms that have been preserved are indistinct and rare to find in the earth’s crust. However, from the evidence available, it is believed that life began about 4 billion years ago when the oceans were formed.

III. Social Environment :
It is also known as cultural or man-made environment. It is concerned with the social behaviour of organisms. All the organisms of the floral and faunal environment organise themselves into social groups and form what is known as the social environment. Social environment involves population interaction and behaviour patterns of animals in response to their environment.

TS Inter 1st Year Environmental Education Study Material Chapter 1 Man and Environment

Question 4.
Explain the impact of Man’s Activities on the Environment.
Answer:
Impact of Man’s Activities on the Environment :
Several human activities like industrialization, urbanization and population growth have adversely affected bio-geo-chemical cycles. The impact of man’s activities on the environment is referred to as the anthropogenic impact on the environment. It includes the impact on biophysical environments, biodiversity and other resources.
TS Inter 1st Year Environmental Education Study Material Chapter 1 Man and Environment 5

Man’s activities have caused a rapid depletion of natural resources. Green House Gas (GHG) emissions (carbon dioxide, methane, etc.) have increased, leading to global warming, climate change and natural disasters. Pollution is fouling the air, water and land. Altered bio-geo-chemical cycles combined with climate change have a negative impact on biodiversity, food security, human health and water quality. The National Wildlife Federation, USA, states that every day 100 plant and animal species are becoming extinct as a result of deforestation. It is estimated that global temperature may increase by more than 2 degrees Celsius by the end of the century, making the earth in hospitable to most species.

The impact of man’s activities on the environment may be long lasting and even irreversible. We can stem the damage to some extent by taking appropriate steps like afforestation, change of farming practices, optimal use of resources and changing our patterns of consumption.

If we compare Earth with other planets in the solar system, we find that while sunlight is available on the other seven planets too, with varying intensities, air and water are available only on Earth. Without air and water, Life, as we know it, cannot exist.

The Environment does not require man. It can exist without human interaction or interference and can sustain billions of species that inhabit the earth. Man, on the other hand, requires the environment for sustenance of life. It is our bounden duty to protect it and ensure that future generations too can live in harmony with Nature.

Question 5.
What is the legacy thet we should leave for future generations?
Answer:
It is just multi-storeyed buildings, massive infrastructure and complex electronic gadgets that we should bequeath our children or a clean environment which supports life and provides sustenance? Man is the most intelligent animal on earth. He is well aware of the havoc he is wreaking on the environment and knows too that the damage he is inflicting on Nature may be irreversible. Even now it is not too late for all of us to save the earth. The majestic mountains, the vast oceans, the rich flora and fauna need to be preserved. Small individual actions will collectively make a huge difference.
TS Inter 1st Year Environmental Education Study Material Chapter 1 Man and Environment 6

Let us all take a pledge, ‘I shall go Green’.
Let us all take a decision to

  • Conserve Water.
  • Conserve Energy.
  • Implement the concept ‘Reduce, Reuse and Recycle’ in our day to day life.
  • Conserve Natural Resources.
  • Minimize activities that cause Pollution Let us not forget.

“We have not inherited the Earth from our ancestors, we have borrowed it from our children.”

Question 6.
Explain water cycle briefly.
Answer:
It refers to the cycle of processes by which water evaporates from the surface of the earth, rises into the atmosphere, cools and condenses into rain or snow in clouds, falls to the surface as precipitation and is collected once again in lakes, rivers and oceans. Solar energy, in the form of heat and light, besides gravity, causes the transfer of water from one state to another over periods ranging from hours to thousands of years. The water cycle is crucial for the sustenance of life and ecosystems on earth.

There are four important stages in the water cycle. In the first stage the sun heats the water on the surface of the earth. The water from lakes, rivers and oceans gets hot and changes into vapour. This process is called evaporation. The water vapour then cools and collects in the sky as clouds. This is called condensation. In the next stage water in the form of rain, snow or hail falls from the clouds. It is called precipitation. The water that falls gets collected in oceans, streams, rivers and lakes. This stage is called collection. The process continues in this manner.
TS Inter 1st Year Environmental Education Study Material Chapter 1 Man and Environment 7

It should be noted that evaporation takes place not only from water but also from snow and plants. Evaporation from snow and ice is called sublimation. Transpiration refers to the expiration of water through the minute pores or stomata of trees. Evapo transpiration is the term used by hydrologists with reference to the three processes together — transpiration, sublimation and evaporation.

TS Inter 1st Year Environmental Education Study Material Chapter 1 Man and Environment

Question 7.
Explain Bio-geo-chemical cycle briefly.
Answer:
Bio-geo-chemical cycles are defined as large scale cycles, involving inorganic substances which pass through a biotic phase and then return to an abiotic or inorganic state. The term is used as the process includes a variety of biological, geological and chemical processes. Many chemicals cycle through biotic (biosphere) and abiotic (lithosphere, atmosphere and hydro-sphere) compartments of the earth. Nutrient elements like car-bon, nitrogen, hydrogen, oxygen and sulphur move through the earth’s atmosphere, ocean and sediments. These cycles are important because important elements are transported and stored suclj that they can be used by living organisms. Given below is an example :
TS Inter 1st Year Environmental Education Study Material Chapter 1 Man and Environment 8

• Plants take nutrients (inorganic elements) through their roots from the soil while animals do so through the intake of food and water. These nutrients get recycled back to the earth after the death and decay of the plants and animals.

Bio-geo-chemical cycles are of two types :

  1. Those that involve cycling of all elements together e.g. Water cycle
  2. Those that involve cycling of individual elements e.g. carbon cycle, nitrogen cycle, oxygen cycle.

Question 8.
Write about Oxygen Cycle.
Answer:

  1. Large amounts of oxygen is present in air (21%).
  2. Some of this O2 is dissolved in water. O2 content in air and water are in equilibrium i.e., whenever O2 content in water decreases, more amount of O2 from air gets dissolved in water. So that the ratio of O2 in air and water always remain constant.
  3. O2 dissolved in water is used for respiration by aquatic plants and animals.
  4. Similarly terrestrial plants and animals use oxygen present in air for their respiration.
  5. The by – products of respiration – carbondioxide and water are released into air.
  6. These two are taken up by plants and are used by photosynthesis.
  7. The by – product of photosynthesis is O2 which is released into air.
  8. Carbondioxide is also formed when fuels like wood, coal and petroleum products are burnt.
  9. There is a fine balance between these processes, so that the total amount of O2 present in air remains constants. All these processes together represent O2 cycle.
    TS Inter 1st Year Environmental Education Study Material Chapter 1 Man and Environment 9
  10. O2 also has another important role in environment. In the upper layers of atmosphere, O2 is converted to ozone. This is another form of oxygen in which each molecule has three oxygen atoms instead of two.
  11. TS Inter 1st Year Environmental Education Study Material Chapter 1 Man and Environment 10
  12. Ozone gas is present at a height of 16 – 23 km from the surface of earth. At this height it covers the entire planet like a blanket.
  13. Light rays reaching earth from such has three components i.e. Ultraviolet rays (uv), visible rays and Infrared rays. Ozone has the property of absorbing ultraviolet light and does not allow it to fall on Earth.

TS Inter 1st Year Environmental Education Study Material Chapter 9 Global Environmental Issues

Telangana TSBIE TS Inter 1st Year Environmental Education Study Material 9th Lesson Global Environmental Issues Textbook Questions and Answers.

TS Inter 1st Year Environmental Education Study Material 9th Lesson Global Environmental Issues

Essay Questions

Question 1.
Write an essay on Global Environmental Issues and its protection.
Answer:
Global Environmental issues :
All across the world, people are facing a plethora of new and challenging environmental problems every day. Some of them are small and affect only a few ecosystems, but others are drastically changing the world as we know it.

Our planet is on the brink of a severe environmental crisis. Current environmental problems make us vulnerable to disasters and tragedies, now as well as in the future. We are in a state of planetary emergency. Unless we address the various issues prudently and seriously, we are doomed to disaster.

Given below are some of the major environmental problems that require urgent attention.

TS Inter 1st Year Environmental Education Study Material Chapter 9 Global Environmental Issues

Major Current Environmental Problems :
i)Pollution :
The ill effects of the pollution of air, water and soil cannot be undone even in a thousand years. Water pollution is caused by oil spill, acid rain and discharge of effluents by industries; air pollution is caused by various gases and toxins released by industries and factories and combustion of fossil fuels; soil pollution is caused mainly by industrial waste that deprives soil of essential nutrients. Pollutants like heavy metals, nitrates and plastic degrade the environment and are a threat to all forms of life.

ii) Global Warming :
Fossil fuel consumption results in emission of greenhouse gases like methane, carbondioxide and nitrous oxide which are responsible for global warming and climate change. Global warming leads to rising temperatures of the oceans and the Earth’s surface, causing melting of polar ice caps, rise in sea levels and also unnatural patterns of precipitation such as flash floods, excessive snow or desertification. Nations throughout the world are taking efforts to shift to renewable sources of energy like solar, wind, biogas and geothermal energy. The cost of installing the infrastructure and maintaining these sources has plummeted in recent years.

iii) Over population :
The population of the planet is reaching unsustainable levels as it faces shortage of resources like water, fuel and food. Population explosion is more pronounced in developing countries. India is expected to become the most populous country in the world in 2022 and by 2030 its population is expected to cross 1.5 billion. Intensive agriculture practised to produce food causes damage to the environment through use of chemical fertilizers, pesticides and insecticides.

iv) Natural Resources Depletion :
Natural resources occur within the environment in their original and natural form, undisturbed by humanity. They may take centuries or even millions of years to form. While some like air and water are vital for our survival, others like coal and minerals are used for satisfying daily needs. Natural resources are getting consumed much faster than they can be replenished or regenerated. This leads to the degradation of the ecosystems.

v) Waste Disposal :
The over consumption of resources and use of plastics is creating a global crisis of waste disposal. Developed countries are notorious for producing an excessive amount of waste or garbage and dumping their waste in the oceans and in less developed countries. Nuclear waste disposal is associated with tremendous health hazards. Plastic, fast food packaging and cheap electronic wastes threaten the well-being of humans and animals.

vi) Climate Change :
Change in regional climate patterns in many parts of the world is another environmental problem that has assumed deadly proportions during the last few decades. Climate change has various harmful effects including melting of polar ice, change in seasons, occurrence of new diseases, frequent occurrence of floods and changes in the overall weather scenario.

vii) Loss of Biodiversity :
It is the extinction of species (human, plant or animal) worldwide and also the local reduction or loss of species in a certain habitat. Human activity is leading to the extinction of species and habitats and loss of biodiversity. Eco systems, which took millions of years to perfect, are in danger of being destabilised when any species population gets decimated. The population of wild bees is rapidly decreasing, posing a threat to global agriculture. Balance of natural processes like pollination is crucial for the survival of the ecosystem. Similarly, the destruction of coral reefs is endangering marine life.

viii) Deforestation :
Forests are natural sinks of carbon dioxide and produce fresh oxygen. They also help in regulating temperature and rainfall. At present forests cover 30% of the land but every year tree cover equal in area to the country of .Panama is lost due to deforestation. Billions of trees are being cut every year to cater to the needs of the growing polulation. The green cover is decreasing in order to make more land available for residential, industrial and commercial purposes.

ix) Ocean acidification :
oceans is called ocean acidification. It is a recent phenomenon. Human activities have led to massive amounts of carbon dioxide being produced. Oceans absorb nearly 30% of carbon dioxide in the air. The carbondioxide that is absorbed reacts with sea-water and makes it acidic. In the past 200 years alone, ocean water has become 30 percent more acidic-faster than any known change in ocean chemistry in the last 50 million years. Ocean acidification is a threat to marine life, particularly shellfish and plankton.

x) Ozone Layer Depletion :
The ozone layer is an invisible layer-of protection around the planet that protects us from the sun’s harmful rays. Depletion of the crucial ozone layer of the atmosphere is attributed to pollution caused by chloro-fluoro carbons (CFCs). Once these toxic gases reach the upper atmosphere, they cause a hole in the ozone layer, the biggest of which is above the Antarctic. CFCs are banned in many industries and consumer products.

xi) Acid Rain:
It is rain polluted by acid that has been released into the atmosphere from factories and other industrial processes. Acid rain occurs due to the presence of certain pollutants in the atmosphere. Acid rains can be caused due to combustion of fossil fuels or erupting volcanoes or rotting vegetation which release sulphur dioxide and nitrogen oxide into the atmosphere. Acid rain adversely affects human health, wildlife and marine life.

xii) Water Pollution :
Clean drinking water is becoming a rare commodity. Water is becoming an economic and political issue as the human population fights for this resource. Industrial development is filling rivers, seas and oceans with toxic pollutants which are a threat to human health. .

xiii) Urban Sprawl :
Urban sprawl refers to the expansion of population from high density urban areas to low density surrounding areas, often without planning. This results in the spreading of the city over more and more rural land. Urban sprawl results in land degradation, increased traffic, environ-mental issues and health issues. The evergrowing demand for land destroys the natural environment.

xiv) Public Health Issues :
Current environmental problems pose a risk to the health of humans and animals. Dirty water is the biggest health risk of the world. Pollutants in the soil, air and water include toxins, chemicals and disease carrying organisms. They cause respiratory diseases like asthma and cardiac- vascUlar problems. High temperatures encourage the spread of infectious diseases like dengue.

TS Inter 1st Year Environmental Education Study Material Chapter 9 Global Environmental Issues

xv) Genetically Modified Foods (GM foods) :
GM food or bio-engineered foods are foods produced from organisms that have changes introduced into their DNA using methods oi genetic engineering. The technique allows the introduction of new traits into the organism. For instance, foods be engineered to become more resistant to weeds and pests. Texture, flavour and nutrient values can be improved. The first GM food was sold commercially in 1994. It was a type of tomato which had a long shelf life. Genetic modification of food sometimes results in increased toxins and diseases as genes from a plant that cause allergies can get transferred to the target plant.

Genetically modified crops can cause serious environmental problems as an engineered gene may prove toxic to wild life. Sometimes excessive toxins are used to make plants resistant to insects. This can cause resultant organisms to become resistant to antibodies. Bt cotton is the first GM crop to be approved in India and it is being cultivated extensively. Bt bringal and GM mustard are ready for commercial use but approval was withheld because of widespread concerns regarding safety of eating GM foods.

There is an urgent need for a change in our way of living. We have caused immense damage to the environment but, at least we can try to prevent further degradation. Even small measures like judicious use of water, electricity, reduction in the usage of plastic and disposable, items, proper segregation of domestic waste and greater use of public transport can go for a long way in protecting our planet. Governments too should play a more protecting roles in striking a balance between developmental activities, and conservation of the environment. If urgent steps are not taken at the individual and collective level, it will soon be too late to save the planet. By raising awareness in the local community and also within the family about such issues, one can help contribute to a more clean and green environment.

TS Inter 1st Year Environmental Education Study Material Chapter 8 Natural and Manmade Disasters

Telangana TSBIE TS Inter 1st Year Environmental Education Study Material 8th Lesson Natural and Manmade Disasters Textbook Questions and Answers.

TS Inter 1st Year Environmental Education Study Material 8th Lesson Natural and Manmade Disasters

Essay Questions

Question 1.
Define Disasters and what are its types? Explain Natural Disasters.
Answer:
A disaster is a sudden, calamitous event that seriously disrupts the functioning of a community or society and causes human, material, and economic or environmental losses that exceed the community’s or society’s ability to cope using its own resources. Disasters can broadly be classified as a) natural disasters b) man-made disasters.

Natural disasters are a major adverse event resulting from natural processes of the Earth. Some examples of natural disasters are : floods, forest fires, hurricanes, tornadoes, volcanic eruptions and earthquakes.

Man-made disasters involve an element of human intent, negligence, or error; or involve a failure of a man-made system. Stampedes, road and railway accidents, plane crashes and fire accidents are examples of man-made disasters which result in human suffering and loss of lives. The damage to the environment is often temporary and negligible. Sometimes, however, the impact of man-made disasters on the environment is colossal and long lasting, There may be a large scale destruction of lives and property. Examples are nuclear disasters, war, industrial accidents and oil spills in the ocean.

Given below are tables containing informanon about various natural and man made disasters and the damage that ensures :

I. Natural Disasters :

TypeDesriptionDamage
EarthquakeAn earthquake is a shak­ing of the ground caused by the sudden breaking and movement of tectonic plates of the Earth’s rocky outermost crust.The shifting masses send out shock waves that may be powerful enough to al­ter the surface of the Earth, thrusting up cliffs and opening great cracks in the ground. Earthquakes cause loss of lives and also great damage, like col­lapse of buildings, broken power and gas lines, land­slides snow avalanches, tsunamis.
Volcanic eruptions
TS Inter 1st Year Environmental Education Study Material Chapter 8 Natural and Manmade Disasters 1
A volcanic eruption oc­curs when hot materials are thrown out of a volca­noes. Eruptions can come from side branches or from the top of the volcano. Kilauea, in Hawaii, is con­sidered one of the worlds most frequently active volcanoes. It erupted in May 2018.Hot lava can travel very far and burn, bury or dam­age buildings and trees in its path. Ash may cause roofs to collapse under its weight. Even small quan­tities can harm humans if inhaled.

The main danger from a volcano is the immense cloud of ash which has a disastrous global effect on climate and temperature for many areas.

CycloneA cyclone refers to any low pressure area with winds spiraling inwards.
TS Inter 1st Year Environmental Education Study Material Chapter 8 Natural and Manmade Disasters 2
The main effects of tropical cyclones include heavy rain, strong wind and large storm surges at landfall.

Sea water with combined force rushes inlands and in­undates the low lying areas.

FloodA flood is an overflow of an expanse of water that submerges land.The primary effects of flooding include loss of life, damage to buildings, bridges, sewerage systems, roadways and canals. Floods also fre­quently damage power tran­smission.
DroughtA drought is a period of below-average precipitation in a given region, resulting in prolonged short­ages in the water supply, whether atmospheric, sur­face water or ground wa­ter.Shortage of water can adversely affect both residen­tial areas and industrial ar­eas.

The formation of dust bowls indicates severe erosion of land.

Diminished crops and se­vere scarcity of food may ensue. Droughts have a dev­astating impact on livestock. Damage to wildlife takes place.

TsunamiA tsunami is a series of water waves caused by the displacement of a large volume of body of water, gen eraliy an ocean or a large lake. Earthquakes, volcanic eruptions and other under water explosions, landslides, glacier calvings (breaking), meteorite impacts and other disturbances above or be­low water all have the po­tential to generate a tsunami.The force of a tsunami cau­ses massive damage and loss of life. The push of saltwater into freshwater sources nearby can disrupt farming, Floodling can also carry sew age and toxic substances into the environment, posing a health risk.
TS Inter 1st Year Environmental Education Study Material Chapter 8 Natural and Manmade Disasters 3
LandslideA landslide is defined as the movement of a mass of rock, debris, or earth down a slope. Landslides are a type of “mass wasting,” which denotes any down-slope movement of soil and rock under the direct influence of gravity.Landslides cause property damage, injury and death and adversely affect a vari­ety of resources. For ex­ample, water supplies, fish­eries, sewage disposal sys­tems, forests, dams and roadways can be affected for years.
EpidemicAn epidemic occurs when a disease strikes a large number of people at one time. It spreads at a rapid rate. E.g.: SARS virus, swine flu, ebola, nipah virus. Many diseases are spread after natural di­sasters like tsunami, floods etc.Loss of lives, damage to the economy, adverse effect on tourism, breakdown of public health infrastructure. A pandemic is the sudden outbreak of a disease that affects a whole region, a con­tinent or the world and causes a high degree of mortality.

II. Man-Made Disasters :

TypeDescription
Nuclear disasterA nuclear accident involves leakage of radioactivity. This can happen in nuclear reactors due to an explosion. An example is the Fukushima Daiichi, Japan, nuclear disaster in 2011. The reactors were damaged by tsunami waves gen­erated by a severe earthquake.
Biological arfareBiological weapons involve the use of toxins or infectious agents that are biological in origin, such as bacteria, viruses, or fungi. These agents are used to spread deadly diseases like smallpox and anthrax and can incapacitate or kill hu­mans, animals or plants as part of a war effort. They are easy to manufacture and transport. Though biological and chemical weapons were banned world wide after World War I, it is believed that some nations continue to develop them secretly.
Chemical disasterDisasters that are caused by the accidental or unintentional release of harzardous substances which can harm human health or the environ­ment. The irresponsible handling of powerful chemicals can cause widespread devastation.
Fire accidentAccidents that are caused due to fire are quite common. Fire results in heavy damage both in terms of life and property. Loss of life is high in a crowded building. The Great Fire of London in 1666 left hundreds of thousands of people homeless and left only a fifth of the city intact.
Travel accidentTravel accidents are quite common. An acci­dent which involves a number of people be­comes a disaster. Examples of these disasters are air crashes, train or vehicles collisions and capsizing of boats.
Terrorism and WarWar ravages countries and decimates human populations. It may take several decades for a country to recoup from the effects of war. The damage to the environment may be irreversible. Terrorists use violence and strike without warn­ing. They use bombs, guns and other weapons to kill people. The hijacking and crashing of planes into the twin towers of the World Trade Centre, New York, in September 2001. is a dark chapter in the history of terrorism.

TS Inter 1st Year Environmental Education Study Material Chapter 8 Natural and Manmade Disasters

Question 2.
Write an essay on Disaster Management.
Answer:
Disaster management is defined as the organization and management of resources and responsibilities for dealing with all. humanitarian aspects of emergencies, in particular preparedness, response and recovery in order to lessen the impact of disasters. It refers not only to steps taken after a disaster occurs, such as providing shelter and food to those affected by an earthquake or fire, and rebuilding property that has been destroyed, but also includes preventive measures that are taken by the government as well as citizens to avert impending loss of life and property when a disaster is expected to take place.

For example, in 2014 when Hudhud, a cyclone of intense severity, was expected to strike the eastern coast of India, fishermen were warned not to venture into the sea, citizens were advised to stay indoors and hourly updates regarding the movements of the cyclone were broadcast. Thousands of people living in low lying areas were evacuated and given shelter in safe places. Though the damage to property in and around Visakhapatnam was colossal, the loss of lives was greatly minimized because of good disaster management.

Given below are some of the measures that can be taken by people to minimize the impact of natural disasters :

Cyclone :

  1. Keep track of the weather warnings that are being broadcast on T.V or the radio. This will help you prepare for an emergency evacuation.
  2. Prepare an emergency kit consisting of dry food, water, warm clothes etc.
  3. Remain indoors. Stay in the strongest part of the building.
  4. Board up the windows and lock the doors.
  5. At the onset of the cyclone, disconnect all electrical appliances and turn off the gas. Do not venture outdoors till it is declared safe to do so.

Heat Weave :

  1. Avoid going out in the Sun, especially between 12.00 noon and 3.00 p.m.
  2. Drink sufficient water and as often as possible, even if not thirsty.
  3. Wear light-weight, light-coloured, loose, and porous cotton clothes. Use protective goggles, umbrella/hat, shoes or chappals while going out in the Sun.
  4. Avoid alcohol, tea, coffee and carbonated soft drinks as these dehydrate the body.
  5. Avoid high-protein food and do not eat stale food.
  6. Use ORS (oral rehydration solution), homemade drinks like lassi, torani (rice water), lemon water and buttermilk which help to re-hydrate the body.
  7. Keep animals in the shade and give them plenty of water to drink.

Sun Stroke :

  1. Make the affected person lie in a cool place or in the shade. Wipe her/him with a wet cloth/wash the body frequently. Pour water of normal temperature on the head. It is important to bring down the body temperature.
    TS Inter 1st Year Environmental Education Study Material Chapter 8 Natural and Manmade Disasters 4
  2. Give the person ORS to drink or lemon sarbat/torani to rehydrate the body.
  3. Take the person immediately to the nearest health centre. The patient needs immediate hospitalisation as heat strokes can be fatal.

Flood :
If a flood is likely to hit your area, one should :

  1. Listen to the radio or television for information.
  2. Be aware that flash flooding can occur. If there is any possibility of a flash flood, move immediately to higher ground. Do not wait for instructions to move.
    TS Inter 1st Year Environmental Education Study Material Chapter 8 Natural and Manmade Disasters 5
  3. Be aware of streams, drainage channels, canyons, and other areas known to flood suddenly. Flash floods can occur in these areas with or without typical warnings such as rain clouds or heavy rain.
  4. Turn off utilities at the main switches or valves if instructed to do so. Disconnect electrical appliances. Do not touch electrical equipment if you are wet or standing in water.

Earthquake :
TS Inter 1st Year Environmental Education Study Material Chapter 8 Natural and Manmade Disasters 6
Have a disaster emergency kit ready which contains: Battery operated torch, battery operated radio, first aid kit, emergency food (dry items) and water (packed and sealed), candles and matches in a waterproof container, chlorine tablets, essential medicines, cash and credit cards, thick ropes and sturdy shoes.

If-indoors :

  1. Drop to the ground; take cover by getting under a sturdy table or other piece of furniture; hold on until the shaking stops. If there is no table or desk near you, cover your face and head with your arms and crouch in an inside corner of the building.
  2. Stay away from glass windows, outside doors and walls, and anything that could fall, (such as lighting fixtures or furniture).
  3. Use a doorway for shelter only if it is in close proximity to you and if you know it is a strongly supported, load bearing doorway.
  4. Stay inside until the shaking stops and it is safe to go outside. Research has shown that most injuries occur when people inside buildings attempt to move to a different location inside the building or try to leave.
  5. Be aware that the electricity or fire alarms may go out.

If-outdoors :

  1. Do not move from where you are. However, keep away from buildings, trees, streetlights and utility wires.
  2. If you are in open space, stay there until the shaking stops. The greatest danger exists directly outside buildings, at exits and alongside exterior walls. Most earthquake-related casualties result from collapsing walls, flying glass and falling objects.

Given below are some measures that can be taken to minimize the impact of Man Made Disasters :

Nuclear Disaster/Exposure to Radiation Disaster :

  1. It is imperative for the management and the government to conduct onsite (within the nuclear plant, where workers are affected) and offsite (surrounding areas where residents are affected) emergency response planning and training, besides conducting mock drills.
  2. In the event of a nuclear disaster, people within a 10 mile ERZ (Emergency Radiation Zone) are evacuated to a safe place so that their risk of being exposed to radiation is minimized.
    TS Inter 1st Year Environmental Education Study Material Chapter 8 Natural and Manmade Disasters 7
  3. Residents may be given potassium iodide tablets by the government to reduce or prevent the effects radiation.
  4. People should not drink water from open wells/ponds; they should avoid crops and vegetables that are grows in a 50 mile ERZ as there are high chances of radioactive contamination of food and water supplies.
  5. People should follow the instructions of the district or civil defence authorities and not panic.

Chemical Disaster :

  1. Do not panic, evacuate the premises calmly and quickly move in a direction that is perpendicular to the wind direction through the designated escape route.
  2. Keep a wet handkerchief or piece of cloth/sari on the face during evacuation.
  3. Keep the sick, elderly, weak and handicapped inside the house and close all the doors and windows tightly.
    TS Inter 1st Year Environmental Education Study Material Chapter 8 Natural and Manmade Disasters 8
  4. Do not consume uncovered food and water left open to the air. Drink only from covered bottles.
  5. Change into fresh clothing after reaching a safe place/shelter and wash hands properly.
  6. Inform Fire & Emergency services, Police and Medical services from the safe location by calling 101, 100 and 108 respectively.
  7. Provide correct and accurate information to government officials.
  8. Inform/Caution others about the occurrence of the event at public gathering places (like schools, shopping centres, theatres etc.).
  9. Do not pay attention to rumours and do not spread rumours.

Fire disaster management :

  1. During a fire do not panic.
  2. Alert the firemen (fire service), ambulance services and nearby police stations.
  3. Use fire extinguishers.
  4. Deaths due to fire accidents mostly occur due to inhalation of smoke and asphyxiation rather than burning. Cover your head with a towel soaked in water and breathe through it.
  5. Evacuation of the trapped people should be undertaken in a systematic manner.
  6. People whose clothes have caught fire should be covered in blankets or coats and rolled on the ground.
  7. Elevators should not be used when there is a fire.

TS Inter 1st Year Environmental Education Study Material Chapter 8 Natural and Manmade Disasters

Question 3.
Discuss some Global Environmental Disasters.
Answer:
London’s Killer Fog Also called the Great Smog of London, it was a severe air pollution event that affected London for several days in December 1952. The city was covered with a thick, black blanket of fog and smoke, containing nitrogen oxide, soot, and sulfur dioxide. Visibility was drastically reduced as the smog entered indoors too. It is estimated that nearly 12,000 people were killed in this disaster.

The Nuclear Power Plant Explosion in Chernobyl, Ukraine :
In April 26, 1986, a reactor shutdown was experienced at the Chernobyl Nuclear Facility. The horrific fire and explosion that ensued claimed the lives of 50 personnel instantly and emitted more than 400 times the radiation released during the Hiroshima atom bomb. More than 4000 cancer deaths have been linked with the extensive spread of radioactive substances. Radiation levels at the site are still high.

Union Carbide Cyanide Gas Leak, Bhopal, India :
On December 3, 1984, a Union Carbide India Limited pesticide plant in Bhopal, Madhya Pradesh, India accidentally released a deadly chemical fog, which killed more than 5,000 people. They were victims of fatal poisoning by methyl isocyanate. More than 50,000 people underwent treatment due to exposure to the gas. It is believed that the gas leak has claimed an additional 20,000 lives since. It is regarded as the worst industrial chemical disaster in history.

Minamata Disease Disaster :
Industrial waste water containing methyl mercury was released by Chisso Corporation into Minamata Bay and the Shiranui Sea in Japan from 1932 to 1968. The highly toxic chemical accumulated in shell fish and other fish. The local people who consumed the fish fell victim to mercury poisoning. The cause of the disease was identified in 1956. About 2000 people died as a result of ‘Minamata disease’ and another ten thousand people were affected seriously.

British petroleum oil spill, Gulf of Mexico : On April 20, 2010, there was an explosion and sinking of the deep water horizon oil rig in the Gulf of Mexico. The explosion was regarded as the most prominent accidental marine oil spill in the petroleum industry history. Eleven employees died. The explosion released about 60 million barrels of mixed grade oil from the disconnected well over a period of four months. Over 34,000 birds (including egrets and blue heron) hundreds of sea turtles, about 72 dolphins and other marine vertebrates and invertebrates were poisoned and suffocated in the oil.

Gulf of Mexico dead zone : This is one of the ill-famed aquatic regions that arose as a consequence of human activity. It is considered the largest “dead zone” region in the United States. Hundreds of fish are often found floating dead in the Gulf of Mexico Dead Zone. The cause for the “dead zone” is the relentless dumping of phosphorus and nitrogen nutrients in the area. The nutrients come from the Mississippi River, which is the drainage area for nearly half the nitrogen and phosphorus waste of continental America. Aquatic species including plants, fish and cannot survive in the area.

E-waste In Guiyu, China :
Guiyu, China is considered the area which is the biggest electronic waste site on the planet. Massive amounts of obsolete electronics are dumped in the area. It has resulted in high toxicity levels of heavy metals and chemicals in the region’s soils and water systems. Consequently, about 88% of the children in the province suffer from lead poisoning and there is a higher than normal rate of miscarriages. The province is labelled the world’s “electronic graveyard”.

TS Inter 1st Year Environmental Education Study Material Chapter 7 Types, Sources and Effects of Pollution

Telangana TSBIE TS Inter 1st Year Environmental Education Study Material 7th Lesson Types, Sources and Effects of Pollution Textbook Questions and Answers.

TS Inter 1st Year Environmental Education Study Material 7th Lesson Types, Sources and Effects of Pollution

Essay Questions

Question 1.
Define Environmental pollution. Explain sources, effects and control measures of air pollution.
Answer:
Environmental pollution can be defined as any undesirable change in the physical, chemical or biological characteristics of any components of the environment (air, water, soil) which can cause harmful effects on various forms, of life or property. In other words, it is the contamination of air, water or soil by substances that are harmful to living beings. The major forms of pollution are air pollution, water pollution and soil pollution. Noise pollution, thermal pollution, nuclear pollution and plastic pollution too are types of pollution. The contamination of the environment by the generation and improper disposal of garbage and other wastes is sometimes referred to as waste pollution. .

Air pollution :
Air pollution is the introduction of particulates or harmful gases into the earth’s atmosphere, causing undesirable effects on man and his environment. Put simply, it is the fouling of the air by harmful substances.

Sources of Air Pollution :
The sources of air pollution are natural and anthropogenic (man-made). Natural sources include volcanic eruptions, forest fires, sea salt sprays and pollen grains. Man-made sources include industrial units, vehicular emissions and agricultural activities.

Indoor air pollution can be more dangerous than outdoor air pollution
TS Inter 1st Year Environmental Education Study Material Chapter 7 Types, Sources and Effects of Pollution 1

Air pollutants and their sources
TS Inter 1st Year Environmental Education Study Material Chapter 7 Types, Sources and Effects of Pollution 2

Effects of Air Pollutants (substances that pollute the air)

Air pollutantTypical sourceEffects
Dust (or) ParticularsMines and quarries, pottery and ceramics, factory stacks.power stations and civil construction works.On human beings- respiratory diseases; diseases like silicosis.
On property- soiling effect and corrosion.
Sulphur dioxidePower houses, sulphuric acid plants, petroleum industry, oil refining, domestic use of fuel.On human beings-suffocation, irritation of throat and eye, respiratory diseases.
On vegetation- destruction of sensitive crops and reduced yield.
On property- corrosion
Nitrogen dioxideAcid manufacture, automobile exhaust, explosive industryOn human beings-irritation, bronchitis, edema of lungs.
On property- darkening of painted surfaces, corrosion.


Air pollutantTypical sourceEffects
Hydrogen sulphideViscose rayon plants, petroleum industry, sewage treatment, tanning industry, dye manufacture.On human beings-irritation of respiratory passages, danger of respiratory paralysis and asphyxiation.
Hydrogen fluorideFertilizer industry, chemical industry, aluminum industry.On human beings-irritation to skin, eyes and mucous membranes, fluorosis, mottling of teeth, respiratory diseases.
On vegetation-destruction of crops On animals-fluorosis in cattle which graze on such vegetation.
Carcinogenic hydrocarbonsOrganic chemical, in­dustry, vehicular traf­fic specially automo­bilesOn human beings cancer.
Carbon monoxideFuel gases, automo­bile exhaust, mines, blast furnaces.On human beings ac­cident, susceptibility due to poisoning effect of gas
OxidantsPhoto-chemical products such as those used in pho­tography, xerox ma­chines, optical whit- eners used in wash­ing powder by in­tense UV radiation.On human beingslung irritation.

On vegetation de­struction of vegetation. On property cracking of rubber and deteriora­tion of textiles; smog for­ mation.

National Air Quality Index :
There are six AQI categories, namely Good, Satisfactory, Moderately polluted, Poor, Very Poor and Severe. Each of these categories is decided based on ambient (existing in the surroundings) concentration values of air pollutants and their likely health impacts, known as health breakpoints. These pollutants include particulate matter, nitrogen dioxide, sulphur dioxide, carbon monoxide, ozone, ammonia and lead.

AQI categories and health breakpoints for the eight pollutants :
Air Quality Index is a tool for effective communication of air quality status to people in terms which are easy to understand. It transforms complex air quality data of various pollutants into a single number (index value), nomenclature and colour.

Control of Air Pollution :

  1. Locating of industries away from residential areas.
  2. Modification of process and/or equipment.
  3. Using low sulphur coal.
  4. Controlling vehicular pollution.
  5. Using mass transport system.
  6. Using non-conventional sources of energy.
  7. Planting more trees and indoor plants.

TS Inter 1st Year Environmental Education Study Material Chapter 6 Development in Telangana

Question 2.
Explain about noise pollution.
Answer:
Noise Pollution :
Unpleasant and unwanted sound is called Noise. The intensity of sound is expressed in decibels (dB).

According to the World Health Organization, sound levels less than 70 dB do not cause damage to living organisms, regardless of how long or consistent the exposure is. Exposure for more than 8 hours to constant noise beyond 85 dB may be hazardous.

TS Inter 1st Year Environmental Education Study Material Chapter 7 Types, Sources and Effects of Pollution 3

Sources of Noise Pollution :
The main sources of noise are various household sources, agriculture machines, modes of transportation (like air, road, rail transportation), industrial operations, construction activities, defence equipment, loud speakers, celebrations, electric home appliances and the bursting of crackers.

Effects of Noise :
i) Interferes with human communication :
In a noisy area communication is severely affected.

ii) Hearing damage :
Noise can cause temporary or permanent hearing loss depending on the intensity and duration of the sound level.

iii) hysiological and Psychological changes :
Continuous exposure to noise may result in hypertension, insomnia (sleeplessness), gastrointestinal and digestive disorders, peptic ulcers, blood pressure changes, behavioral changes and emotional changes.

Ambient Air Quality Standards in respect of Noise recommended by CPCB :
TS Inter 1st Year Environmental Education Study Material Chapter 7 Types, Sources and Effects of Pollution 4
Day time : 6.00 a.m. to 10.00 p.m. (16 hours); Night time : 10.00 p.m. to 6.00 a.m. (8 hours)

Noise Pollution during Deepawali :
Noise quality is affected by the fireworks during Deepawali festival. Deepawali is a festival of lights. It is celebrated with great enthusiasm all over India during the month of October or November (onset of winter).

Deepawali is celebrated by bursting crackers and fireworks, which increase the pollution load in terms of air and noise quality. Fireworks contain chemicals such as aluminium, potassium nitrate, copper compounds, antimony sulphide, arsenic, sulphur, manganese, potassium perchlorate, chrontium nitrate and barium nitrate.

Control of Noise Pollution :

  1. Reduction of noise at source.
  2. Proper oiling of machinery.
  3. Use of sound absorbing silencers.
  4. Planting more trees.
  5. Banning of crackers.

TS Inter 1st Year Environmental Education Study Material Chapter 7 Types, Sources and Effects of Pollution 5

Question 3.
Explain water pollution.
Answer:
Water pollution is defined as the alteration of physical, chemical and biological characteristics of water resulting in harmful effects on life systems.

Sources of water pollution :
TS Inter 1st Year Environmental Education Study Material Chapter 7 Types, Sources and Effects of Pollution 6

Types of Water Pollution :
TS Inter 1st Year Environmental Education Study Material Chapter 7 Types, Sources and Effects of Pollution 7

Effects of Water Pollution :

  1. Sewage and domestic wastes affect human health resulting in diseases such as cholera, typhoid, dysentery.
  2. Industrial discharges contain metals like lead, mercury and cadmium, which have a deleterious impact on life systems. They also contain harmful chemicals like arsenic.
    Lead – damages liver end kidneys.
    Arsenic – lung cancer, ulcers in gastro intestinal tract.
    Cadmium- diarrhea, kidney cysts, bone deformation. Mercury – neurological disorders,
  3. Agricultural discharges include fertilizers and pesticides which are toxic to both aquatic and human life.

Marine pollution can mean plastic litter, other litter such as glass bottles and cans, oil and chemical spills or polluted stormwater from drains and rivers flowing into the sea.
TS Inter 1st Year Environmental Education Study Material Chapter 7 Types, Sources and Effects of Pollution 8

Control of Water Pollution :

  1. Restricted use of pesticides.
  2. Prevent run-off of fertilizers and manure (washing away of fertilizers and manure into nearby water sources or leaching into ground water).
  3. Stop entry of sewage into water bodies.
  4. Stop letting out industrial effluents into water bodies.

TS Inter 1st Year Environmental Education Study Material Chapter 6 Development in Telangana

Question 4.
Write about Soil Pollution.
Answer:
Soil pollution is defined as the presence of toxic chemicals (pollutants or contaminants) in soil, in high enough concentrations to pose a risk to human health and/or the ecosystem. Causes of Soil Pollution : There are two main causes through which soil pollution is generated: anthropogenic (manmade) causes as natural causes. .

Man-made Soil Pollutants :
Man-made soil pollution is usually caused by the improper disposal of waste coming from industrial or urban sources, industrial activities and agricultural pesticides and also due to accidental spills.

Natural Soil Pollutants :
Natural processess can lead to an accumulation of toxic chemicals in the soil. This type of contamination has been accorded only in a few cases, such as the accumulation of high levels of perchlorate in soil from the Atacama Desert in Chile, a type of accumulation which is purely due to natural processes in arid environments.

Effects of Soil Pollution :

  1. Sewage sludge contains many pathogenic organisms, bacteria, viruses and intestinal worms which cause various diseases.
  2. Industrial discharges like acids, alkalis, pesticides, insecticides, weedicides and fungicides affect soil fertility by causing changes in the physical, chemical and biological properties.
  3. There is an increase in salinity when soil gets polluted by nitrate and phosphate deposits used in fertilizers and pesticides. Plants cannot grow properly in saline soil and they can be poisonous to humans when consumed.
  4. Crops grown on polluted soils become unfit for human consumption as they become poisoned with chemicals and metals that have leached into the soil from industries.
  5. Soil pollution causes water and air pollution. Water contamination takes place when toxic chemicals from the soil leach into groundwater. Air is fouled by toxic chemicals and gases that are discharged into the air by polluted soil.
  6. Radioactive wastes discharged form industries and laboratories into the soil can cause neurological damage, loss of hair and nausea.

Control of Soil Pollution :

  1. Effluents should be properly treated before being discharged into the soil.
  2. Wastes should be properly collected and disposed of by appropriate methods.
  3. Recovery of useful products from wastes should be encouraged.
  4. Biodegradable organic waste should be used for generation of biogas.
  5. Microbial degradation of biodegradable substances.

Question 5.
Write about thermal, nuclear and plastic pollution.
Answer:
Thermal Pollution :
Thermal pollution is the industrial discharge of heated water into a river, lake or other body of water, causing a rise in temperature that endangers aquatic life and harms others who use the water.

Effects of Thermal Pollution :

  1. The dissolved oxygen of the content of water decreases.
  2. Fish migration is affected due to formation of various thermal zones.
  3. Composition of flora and fauna changes as sensitive species are replaced by species which are temperature tolerant.

Control of Thermal Pollution :
The following methods can be employed for control:

  1. Cooling ponds
  2. Cooling towers
  3. Spray ponds or reservoirs in which warm water, usually from thermal plants, is cooled before reuse.

Nuclear Pollution :
The term refers to the risk or danger to human health or the environment posed by radiation emanating from the atomic nuclei of a given substance, or the possibility of an uncontrolled explosion originating from a fusion or fission reaction of atomic nuclei.

Sources of Radioactivity :
i) Natural Sources :
Cosmic rays from outer space, radioactive radon – 222, soil, rocks, air, water and food, which contain one or more radioactive substances.

ii) Anthropogenic Sources :
Nuclear power plants, nuclear accidents, X-rays.

Effects of Radiation :
TS Inter 1st Year Environmental Education Study Material Chapter 7 Types, Sources and Effects of Pollution 9

Control of Nuclear Pollution :

  1. The site of the nuclear power plant should be carefully chosen after studying long term and short term effects.
  2. Proper disposal of radioactive wastes from the laboratory should be undertaken.

VII) Plastic Pollution :
Plastic pollution is the accumulation of plastic products in the environment to the extent that it adversely affects wildlife, wildlife habitat, or humans. Plastic is cheap and durable. It is present in thousands of articles we use in daily life, whether in furniture or toys, carpets or containers, diapers or mobile phones. ‘Use and throw’ disposable plastic plates and glasses, plastic articles such as bottled drinks, straws, shopping bags and packaging material are commonly used even in developing countries.

Plastic may be convenient to use but it is very harmful to the environment. Landfill areas are filled with mounds of plastic. As plastic is not biodegradable, it remains as debris in the soil or is washed away into the water and remains there for hundreds of years without decomposing. It releases harmful chemicals into the soil. These chemicals seep into groundwater and harm species that drink the water. Plastic fishing nets used for trawling operations lie submerged in water and leak toxins. Sea animals get entwined in these nets and die.

It is estimated that since the 1950s more than 6 billion tonnes of plastic have been produced, of which only a fifth has been recycled or incinerated. Plastic is clogging the sewage system and leaching harmful chemicals into the soil, air and water. It chokes marine life and kills land animals which ingest it by mistake. Plastic is suspected of being a causative factor in several diseases which afflict human beings, including cancer. It can also cause genetic mutations.

Given below are diagrams which point out the harmful effects of plastic and the measures we can take to reduce plastic pollution.

TS Inter 1st Year Environmental Education Study Material Chapter 7 Types, Sources and Effects of Pollution 10
India hosted the global World Environmental Day celebrations on 5 June 2018. “Beat Plastic Pollution”, the theme for World Environment 2018, urges governments, industry, communities, and individuals to come together and explore sustainable alternatives and urgently reduce the production and excessive use of single- use plastic which pollutes our oceans, damages marine life and threatens human health.

The term
“plastic” derives from the Greek
“plastikos,” meaning fit for molding, and
“plastos,” meaning molded.
Plastics are polymers (meaning “many parts” in Greek),
‘ which are basically substances or molecules made up of many’
repeating molecular units, known as monomers (meaning “one
part” in Greek).
Monomers of hydrogen and carbon – hydrocarbons – are
linked together in long chains to form plastic
Dolymers. The raw hydrocarbon material for mosj,
synthetic plastics is derived
from petroleum etc.

TS Inter 1st Year Environmental Education Study Material Chapter 7 Types, Sources and Effects of Pollution 12

TS Inter 1st Year Environmental Education Study Material Chapter 6 Development in Telangana

Question 6.
Write about solid waste pollution.
Answer:
Waste can be defined as a material or substance that is eliminated or discarded as it is no longer useful or required after the completion of a process. Waste pollution is the fouling of the environment by wastes. Ther term ‘solid waste’ refers to any material that is discarded by being abandoned or thrown away. It includes garbage, refuse, sludge and discarded materials. It may consist of not only solids but semisolids, liquids and gaseous substances too. Solid waste can be classified as .municipal, industrial, agricultural, medical, mining waste and sewage sludge.

Different Types of Wastes :
i) Municipal Solid Waste :
Municipal waste contains a variety of discarded materials like polyethylene bags, empty metal and aluminum cans, scrap metals, glass bottles, waste paper, diapers, cloth/rags, and food waste.

ii) Industrial Waste :
Such wastes are generated due to processes and activities pertaining to industry, manufacturing, mining, and agriculture. Industrial waste can be classified as hazardous or non-hazardous. Hazardous waste may be flammable, corrosive or reactive, such as chemical solvents, metals, and paper products. They.should be disposed of very carefully. Non-hazardous industrial wastes include sludge and demolition debris such as bricks. They are usually accepted in landfills.

iii) Bio-Medical Waste :
Waste in any form from hospitals, clinics, pathological laboratories, and blood banks is referred to as bio-medical waste. Examples are: discarded syringes, gloves, and bandages, unwanted samples of human and animal blood, urine, and tissues, discarded medicines.

iv) Electronic Waste :
E-waste or electronic waste refers to discarded electrical and electronic equipment including their components, consumables, and spares. Examples are computers, TVs, and mobile phones which have been discarded as they have reached the end of their ‘useful life’.

v) Construction and Demolition Wastes :
Wastes or debris generated during construction, demolition or renovation of buildings. The wastes include concrete, brick, wood, steel and plaster.

Effects of Waste Pollution :
i) Municipal solid wastes pile up on the roads due to improper disposal. This type of dumping allows biodegradable materials to decompose under uncontrolled and unhygienic conditions. The garbage produces a foul smell and is a breeding ground for various types of insects and harmful micro – organisms, besides spoiling the aesthetics of the site.

5 R concept for Waste Management
TS Inter 1st Year Environmental Education Study Material Chapter 7 Types, Sources and Effects of Pollution 13

ii) Industrial solid wastes are sources of toxic metals and hazardous wastes. The harmful chemicals discharged into the water, land and air have adverse effects on human health, besides fouling the environment.

iii) Toxic substances may leach or percolate to contaminate the ground water.

iv) Various types of wastes like cans, pesticides, cleaning solvents, batteries (zinc, lead or mercury), radioactive materials, plastics and e-waste are mixed up with paper, scrap and other non-toxic materials which can be recycled. Burning of some of these materials produces toxic gases which have the potential to cause various types of ailments including cancer.

Handling of Waste :
Waste management is the collection, transportation and disposal of garbage, sewage and other waste material. The adverse effects of solid wastes can be minimized through proper waste management. It is necessary to create public awareness through information, education and communication campaigns and to educate those who generate waste on the following :

  1. not to litter.
  2. minimise generation of waste.
  3. reuse waste to the extent possible.
  4. practice segregation of waste into bio-degradable, non-biodegradable (recyclable and combustible), sanitary waste and domestic hazardous wastes at Source.
  5. practise home composting, vermicomposting, bio-gas generation and community level composting.
  6. wrap sanitary waste securely in pouches and place the same in the bin meant for non-biodegradable waste.
  7. store segregated waste at source in different bins.
  8. hand over segregated waste to waste pickers, waste collectors, recyclers or waste collection agencies.
  9. pay monthly user fees to waste collectors or local bodies for sustainability of solid waste management.
  10. stop land filling or dumping of mixed waste.
  11. allow only non-usable, non-recyclable, non-biodegradable, non-combustible and non-reactive inert waste to go to the sanitary landfill.

SEGREGATE WASTE AT HOME

Hazardous waste :
Tube lights & bulbs, Batteries, Cleaning agents, Paints, Oils, Aerosol cans, Cosmetics, Insecticides, Medicines, Syringes, Thermometers, and E-waste (computer and mobile parts)

Debris :
Dust, Drain silt, Ashes, Broken bricks, Broken glass, Construction waste, Demolition waste

Sanitary Waste :
Sanitary napkins, Disposable diapers, Bandages, and Any material contaminated with blood

Dry Waste :
Glass, Wire, Cloth, Leather, Rubber, Thermacol, Metal, Paper Plastic, Wood, Rubber, Rexine, Leather, Fabric.

Garden waste :
Fallen leaves, Trimmed branches, Lawn trimming, Weeds

Wet Waste :
Cooked food, Uncooked food, Fruits, Vegetable peels, Flower waste

TS Inter 1st Year Economics Study Material Chapter 4 Production Analysis

Telangana TSBIE TS Inter 1st Year Economics Study Material 4th Lesson Production Analysis Textbook Questions and Answers.

TS Inter 1st Year Economics Study Material 4th Lesson Production Analysis

Long Answer Questions

Question 1.
Critically examine the law of variable proportions. [Mar. ’16]
Answer:
The law of variable proportions has been developed by the 19th-century economists David Ricardo and Marshall. The law is associated with the names of these two economists. The law states that by increasing one variable factor and keeping other factors constant, how to change the level of output, total output first increases at an increasing rate, then at a diminishing rate, and later decreases. Hence, this law is also known as the “Law of Diminishing returns”.

Marshall stated it in the following words.
“An increase in capital and labour applied in the cultivation of land causes, in general, less than proportionate increase in the amount of produce raised, unless it happens to coincide with an improvement in the arts of agriculture”.

Assumptions :

  1. The state of technology remain constant.
  2. The analysis relates to short period.
  3. The law assumes labour in homogeneous.
  4. Input prices remain unchanged.

Explanation of the Law :
Suppose a farmer has ‘4’ acres of land he wants to increase output by increasing the number of labourers, keeping other factors constant. The changes in total production, average product and marginal product can be observed in the following table.
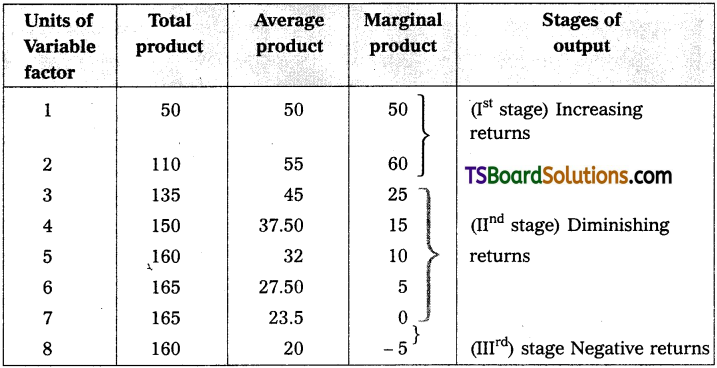
TS Inter 1st Year Economics Study Material Chapter 4 Production Analysis 1

In the above table total product refers to the total output produced per unit of time by all the labourers employed.

Average product refers to the product per unit of labour marginal product refers to additional product obtained by employing an additional labour.

In the above table there are three stages of production.

1st stage i.e., increasing returns at 2 units total output increases average product increases and marginal product reaches maximum.

2nd stage i.e., diminishing returns from 3rd unit onwards TP increases at diminishing rate and reaches maximum, MP becomes zero and AP continuously decreases.

3rd stage i.e., negative returns from 8th unit TP, decreases AP declines and MP becomes negative.

This can be explained in the following diagram.
TS Inter 1st Year Economics Study Material Chapter 4 Production Analysis 2

In the diagram, on ‘OX’ axis shown units labourer and ‘OY axis show TP, MP, and A.P. 1st stage TP AP increases and MP is maximum. In the 2nd stage TP is maximum, AP decreases and MP is zero. At 3rd stage TP declines, AP also declines, MP becomes negative.

TS Inter 1st Year Economics Study Material Chapter 4 Production Analysis

Question 2.
Explain the law of returns to scale. [Mar. ’17]
Answer:
The law of returns to scale relate to long run production function. In the long run it is possible to alter the quantities of all the factors of production. If all factors of production are increased in given proportion the total output has to increase in the same proportion. Ex : The amounts of all the factors are doubled, the total output has to be doubled, increasing all factors in the same proportion is increasing the scale of operation. When all inputs are changed in a given proportion, then the output is changed in the same proportion. We have constant returns to scale and finally arises diminishing returns. Hence, as a result of change in the scale of production, total product increases at increasing rate, then at a constant rate and finally at a diminishing rate.

Assumptions :

  1. All inputs are variable.
  2. It assumes that state of technology remains the same. The returns to scale can be shown in the following table.
TS Inter 1st Year Economics Study Material Chapter 4 Production Analysis 3
The above table reveals the three patterns of returns to scale. In the 1st place, when the scale is expanded upto 3 units, the returns are increasing. Later and upto 4th units, it remains constant and finally from 5th onwards the returns go on diminishing.
TS Inter 1st Year Economics Study Material Chapter 4 Production Analysis 4

In the diagram, on ‘OX’ axis shown scale of production, on ‘OY’ axis shown total product. RR1 represents increasing returns R1S – Constant returns; SS1 represents diminishing returns.

Question 3.
Describe the internal and external economies.
Answer:
Economies of large scale production can be grouped into two types.

  1. Internal economies
  2. External economies.

1. Internal Economies :
Internal economies are those which arise from the expansion of the plant, size or from its own growth. These are enjoyed by that firm only.

“Internal economies are those which are open to a single factory or a single firm independently of the action of other firms.” – Cairncross

i) Technological Economies :
The firm may be running many productive establishments. As the size of the productive establishments increase, some mechanical advantages may be obtained. Economies can be obtained from linking process to another process i.e., paper making and pulp making can be combined. It also uses superior techniques and increased specialization.

ii) Managerial Economies :
Managerial economies arises from specialisation of management and mechanisation of managerial functions. For a large size firm it becomes possible for the management to divide itself into specialised departments under specialised personnel. This increases efficiency of management at all levels. Large firms have the opportunity to use advanced techniques of communication, computers etc. All these things help in saving of time and improve the efficiency of the management.

iii) Marketing Economies :
The large firm can buy raw materials cheaply, because it buys in bulk. It can secure special concession rates from transport agencies. The product can be advertised better. It will be able to sell better.

iv) Financial Economies :
A large firm can arise funds more easily and cheaply than a small one. It can borrow from bankers upon better security.

v) Risk Bearing Economies :
A large firm incurs unrisk and it can also reduce risks. It can spread risks in different ways. It can undertake diversifications of output. It can buy raw materials from several firms.

vi) Labour Economies :
A big firm employs a large number of workers. Each worker is given the kind of job he is fit for.

2. External Economies :
An external economy is one which is available to all the firms in an industry. External economies are available as an industry grows in size.

i) Economies of Concentration :
When a number of firms producing an identical product are localised in one place, certain facilities become available to all. Ex : Cheap transport facility, availability of skilled labour etc.

ii) Economies of Information :
When the number of firms in an industry increases collective action and co-operative effort becomes possible. Research work can be carried on jointly. Scientific journal can be published. There is a possibility for exchange of ideas.

iii) Economies of Disintegration :
When the number of firms increases, the firm may agree to specialise. They may divide among themselves the type of products of stages of production. Ex : Cotton industry.

TS Inter 1st Year Economics Study Material Chapter 4 Production Analysis

Question 4.
Explain short-run costs illustrations.
Answer:
Costs are divided into two categories i.e.,

  1. Short run cost curves
  2. Long run cost curves.

In short run by increasing only one factor i.e., (labour) and keeping other factor constant. The short run cost are again divided into two types.

  1. General costs
  2. Economic costs.

1. General Costs :
i) Money Costs :
Production is the outcome of the efforts of factors of production like land, labour, capital and organisation. So, rent to land, wage to labour, interest to capital and profits to entrepreneur has to be paid in the form of money is called money cost.

ii) Real Cost :
Adam Smith regarded pains and sacrifices of labour as real cost. So, it cannot be measured interms of money.

iii) Opportunity cost :
Factors of production are scarce and have alternative uses. The opportunity cost of a factor is the benefit that is foregone from the next best alternative use.

2. Economic Costs :
i) Fixed Costs :
The cost of production which remains constant even when the production may be increased or decreased is known as fixed cost. The amount spent by the cost of plant and equipment, permanent staff are treated as fixed costs.

ii) Variable Cost :
The cost of production which is changing according to changes in the production is said to be variable cost. In the long period all costs are variable costs. It includes prices of raw materials, payment of fuel, excise taxes etc. Marshall called it as “Prime cost”.

iii) Average Cost :
Average cost means cost per units of output. If we divided total cost by the number of units produced, we will get average cost.
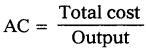
TS Inter 1st Year Economics Study Material Chapter 4 Production Analysis 5

iv) Marginal Cost :
Marginal cost is the additional cost of production producing one more unit.
MC = \(\frac{\Delta \mathrm{TC}}{\Delta \mathrm{Q}}\)

v) Total cost :
Total cost is the sum of total fixed cost and total variable cost.
TC = FC + VC

The short term cost in relation to output are explained with the help of a table.
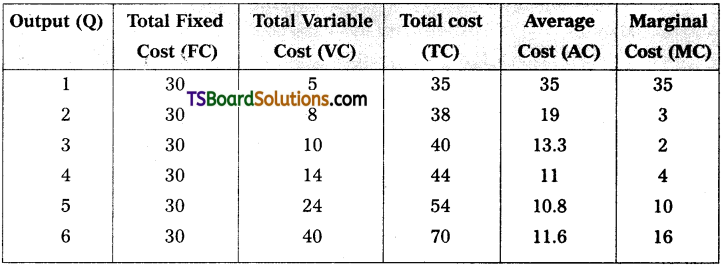
TS Inter 1st Year Economics Study Material Chapter 4 Production Analysis 6
TS Inter 1st Year Economics Study Material Chapter 4 Production Analysis 7

In the above table shows that as output is increased in the 1st column, fixed cost remains constant. Variable costs have changed as and when there are changes in output. To produce more output in the g TVC short period, more variable factors have to be employed. By adding FC & VC we get total cost at different levels of output. AC falls output increases, reaches its minimum and then rises MC also change in the total cost associated with a change in output. This can be shown in the diagram.

In the above diagram is on ‘OX’ axis taken by output and ‘OY axis is taken by costs. The shapes of different cost curves explain the relationship between output and different costs. TFC is horizontal to ‘X’ axis. It indicates that increase in output has no effect on fixed cost. TVC on the other side increases along with level of output. TC curve rises as output increases.

Question 5.
Write an essay on revenue analysis.
Answer:
The amount of money that the producer receives in exchange for the goods (sale proceeds) is called producer’s receipts or revenue. In other words, the total sale proceeds of a firm are known as revenue. We can conceive three types of revenue. They are : total revenue, average revenue and marginal revenue.

a) Total Revenue (TR) :
Total amount of money or income received by the firm from the sale of a certain quantity of output is called total revenue. It is obtained by multiplying the price of a commodity by the number of units sold, i.e., TR = PQ.

Where, P = Price of the good and Q = the quantity of the good sold.

b) Average Revenue (AR) :
Average revenue is the revenue per unit of goods sold. It is computed by dividing the total revenue by the number of the units of a good sold. Thus, AR = TR / Q = PQ / Q = P. It is clear from the above formula that the average revenue at each level of output is equal to the price per unit.

c) Marginal Revenue (MR) :
It is the net addition to the total revenue by selling additional units of the goods i.e. the revenue which would be earned by selling an additional unit of the good. Marginal revenue can be expressed as : MR = ∆TR / ∆Q, where, ∆TR = change in total revenue and ∆Q = change in quantity. In other form, MRn = TRn – TRn-1.

AR and MR Curves under Perfect Competition :
Under perfect competition, there exist large number of sellers and large number of buyers. The sellers under this competition offer homogenous products and, therefore, neither sellers nor buyers have any control on the price of the product. The seller can sell any amount of the good and buyers can buy any amount of the good at the ruling market price. In this case, total revenue (TR), average revenue (AR) and marginal revenue (MR) of a perfectly competitive firm are analyzed here under using table and diagram.
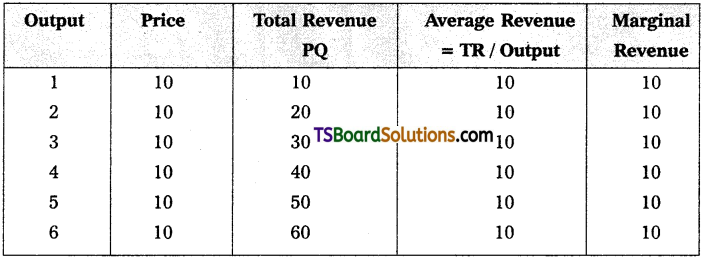
TS Inter 1st Year Economics Study Material Chapter 4 Production Analysis 8

Since the price of the product remains constant under perfect competition, the output sold increases and therefore, revenue also increases. Due to homogeneity, the goods are sold at single price under perfect competition therefore, additional units are also sold at the same price. Hence, under this competition, the AR equals MR all through. Because of this, P = AR= MR. The nature of AR and MR curves is shown with the help of figure.

By the diagram, output is measured on OX axis and price / AR / MR on OY axis. OP price in the diagram indicates existence of single price. Since, P = AR = MR, the AR and MR curves will be parallel to OX axis as shown in figure.
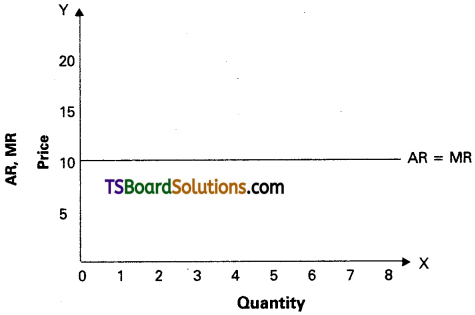
TS Inter 1st Year Economics Study Material Chapter 4 Production Analysis 9

AR and MR Curves under Monopoly :
Under monopoly, there is a single seller. The commodity offered by a monoplist may be or may not be homogenous. Monopolist can control price and output of the commodity, but he can’t determine both simultaneously due to existence of left to right downward sloping demand curve in the market. He can sell more quantity at lower price and less quantity at higher price. The relationship between TR, AR and MR is shown in table.
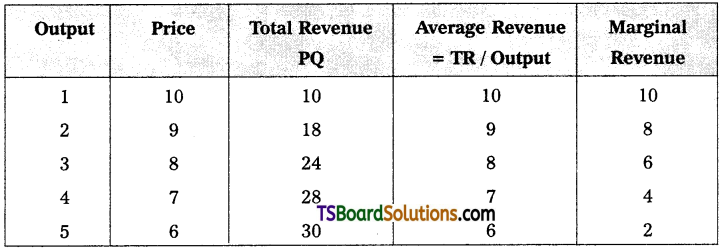
TS Inter 1st Year Economics Study Material Chapter 4 Production Analysis 10

The table reveals that as price falls, sales may improve and total revenue also increases but average revenue (AR) and marginal revenue falls continuously. Here, MR declines at faster rate than that of AR. Thus, MR curve lies below the AR as shown in the figure.
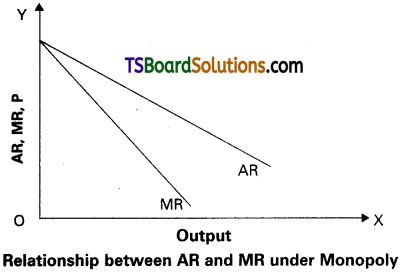
TS Inter 1st Year Economics Study Material Chapter 4 Production Analysis 11
In figure, AR and MR represent average revenue and marginal revenue curves re-spectively. The monopolist can sell higher quantity at lower price and therefore, always AR is greater than MR. Thus, AR curve lies above MR curve.

Short Answer Questions

Question 1.
Describe the main features of factors of production, namely land and labour.
Answer:
Land, labour, capital and entrepreneurial ability (organisation) are called as factors of production which make it possible to produce goods and services. The basic features of these factors of production are presented in the following paragraphs.

1) Land (N) :
The term land is used in a special sense in economics. It does not mean soil or earth’s surface alone but refers to all free gifts of nature which include besides land, in common practice, natural resources, fertility of soil, water, air, natural vegetation etc.

Characteristics of Land :
We may list the following characteristics of land as a factor of production.

  • Land is a free gift of nature.
  • The supply of land is perfectly inelastic from the point of view of the economy.
  • Land cannot be shifted from one place to another place.
  • Land is said to be a specific factor of production in the sense that it does not yield any result unless human efforts are employed.
  • Land provides infinite variation of degree of fertility and situation so that no two pieces of land are exactly alike.

2) Labour (L) :
The term labour means mental or physical exertion directed to produce goods or services. In economics it is used in a wider sense. Any work, whether manual or mental, which is undertaken for a monetary consideration is called labour.

Characteristics of Labour :
Let us identify the characteristics of labour :

  • Labour is inseparable from the labourer himself. It implies that whereas labour is sold, the producer of labour retains the capacity to work.
  • Labour is highly ‘perishable’ in the sense that a day’s loss of labour cannot be stored and so he has no reserve price for his labour.
  • Labour has a very weak bargaining power.
  • Labour power differes from labourer to labourer. Therefore, labour may be classified as unskilled labour, semi skilled labour and skilled labour.
  • The supply curve of a labourer is backward bending.

TS Inter 1st Year Economics Study Material Chapter 4 Production Analysis

Question 2.
What are the merits and demerits of divisions of labour?
Answer:
It is an important feature of modern industrial organization. It refers to scheme of dividing the given activity among workers in such away that each worker is supposed to do one activity or only a limited and narrow segment of an activity. Thus, division of labour increases output per worker on account of higher efficiency and specialized skill.

Advantages :

  1. Increase in productivity,
  2. Inventions are facilitated,
  3. Saving in time,
  4. Diversity of employment,
  5. Mechanization is possible,
  6. Increase in dexterity and skills,
  7. Large scale production is possible,
  8. Right man in the right place.

Disadvantages :

  1. Leads to monotony,
  2. Retards human development,
  3. Loss of skill,
  4. Possibility of unemployment,
  5. Hindrance to mobility of labour.

Question 3.
Explain the Diminishing Returns.
Answer:
Diminishing Returns :
After the stage of increasing returns, stage of diminishing returns will take place. This is known as the law of diminishing returns. Diminishing returns stage starts when the average product is maximum and continues upto the level of zero marginal product and maximum total product. Table shows this stage when the workers are employed from four to seven. From Q to Q1 on OX axis shows the diminishing returns stage. In this stage, the total product increases at a diminishing rate and the average and marginal products decline. In this stage TP > AP > MP. Production is profitable only in the stage of diminishing returns.

Question 4.
Explain the concept of returns to scale.
Answer:
The law of returns to scale is concerned with the study of production function in the long run. The law of returns to scale studies the behaviour of output in response to change in scale. A change in scale means that all inputs or factors are varied in the same proportion, keeping the factor proportions constant. When a producer increases all the inputs in a given proportions, there are three possibilities, viz., total output may increase more than proportionately, just proportionately or less than proportionately. According to returns to scale concept, these possibilities are familiarly known as a) Increasing Returns To Scale (IRTS), b) Constant Returns To Scale (CRTS) and c) Decreasing Returns To Scale (DRTS).

Assumptions :

  1. All inputs except entrepreneurship are variable.
  2. State of technology remains the same.
  3. There is perfect competition in the market.
  4. Production is measured in physical quantities.
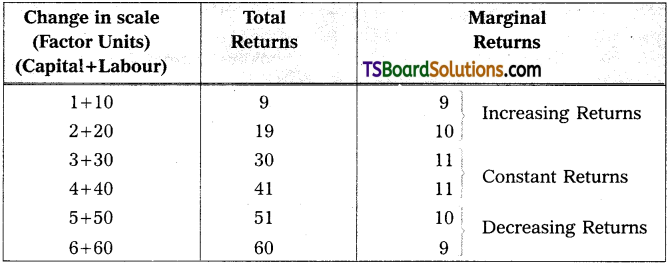
TS Inter 1st Year Economics Study Material Chapter 4 Production Analysis 12

Explanation of the Law :
A description on returns to scale is presented in table. It can be seen from this table that the total product is 9 units in the beginning with 10L + IK. As the factors of production are doubled (20L + 2K), the total output increased to 19 units, which is more than proportional change and therefore, it represents increasing returns to scale (IRTS). Marginal product (MP) increased from 9 to 10 units uder this stage.

MP is remaining the same at 11 units when the scale is 30L + 3K and 40L + 4K therefore, it denotes constant returns to scale (CRTS). A decrease in MP is observed at 50L + 5K and 60L + 6K. This situation can be called as decreasing returns to scale (DRTS). These three kinds of returns to scale are also explained by using figure. In this figure, R to R1 shows IRTS, R1 to S shows CRTS and S to S1 indicates DRTS.
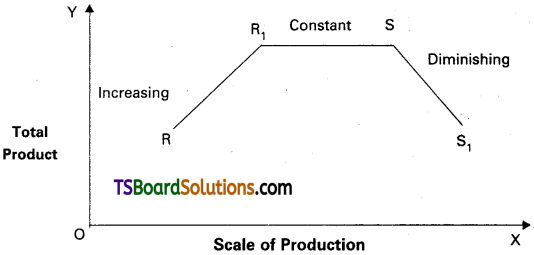
TS Inter 1st Year Economics Study Material Chapter 4 Production Analysis 13

Question 5.
Write a note on Capital.
Answer:
Capital as that part of wealth of an individual or a community which is used for further production of wealth. Capital (stock concept) yields periodical income (flow concept). Capital is nothing but ‘produced means of production’. The term capital is generally used for capital goods, E.g. plant and machinery, tools and accessories, stocks of raw materials, goods in process and fuel.

Types of Capital: Capital can be classified into :
1) Real Capital and Human Capital :
Real capital refers to physical goods, i.e., buildings, plant, machinery etc. As against this, human capital refers to human skill and ability.

2) Individual Capital and Social Capital :
Individual capital is the personal property, and the other, social capital is what belongs to the community as a whole in the form of roads, bridge etc.

3) Fixed Capital and Variable Capital :
Expenditure incurred on machinery and building in the production process is called as fixed capital. The amount spent on purchase of raw materials, daily wages to labour, electricity charges etc., are known as variable capital.

4) Tangible Capital and Intangible Capital :
Tangible capital may be perceived by senses where as intangible capital is in the form of certain rights and benefits. Eg. goodwill, patent rights, etc.

Importance of Capital :
Let us point out the importance of capital in brief.

  1. Capital plays a very vital role in the modem productive system. Production without capital is almost impossible.
  2. The productivity of work force depends upon the amount of capital available per worker. The greater the capital per worker, the greater the efficiency and productivity of the worker.
  3. Capital occupies a central position in the process of economic development.
  4. It promotes the technological progress.
  5. It helps in the creation of employment opportunities.

TS Inter 1st Year Economics Study Material Chapter 4 Production Analysis

Question 6.
What are the internal economies of scale?
Answer:
Economies of large scale production can be grouped under two headings. They are Internal economies and external economies. Let us discuss them.

Internal Economies :
The word ‘internal’ is used here to denote the limitations of these economies to the firm itself. According to Caimcross, “Internal economies are those which are open to a single factory or a single firm independently of the action of other firms”. Internal economies results in from an increase in the scale of output of a firm and cannot be achieved unless output increases. In other words, internal economies are those economies in production which accrue to the firm itself when it expands its output or enlarges its scale of production. In short, they arise simply due to the increase in the scale of production.

Firms experience the following types of internal economies :
a) Technical Economies :
Technical factors affect the returns to scale. Large firms will have more resources at their disposal. Therefore, these firms can install the most suitable machinery. As a result, larger firms experience lower costs of production. There are four different ways in which technical economies can arise. They are :

  • large size machines,
  • linking process, E.g. paper making and pulp making,
  • superior techniques and
  • increased specialization.

b) Managerial Economies :
With the increase in the scale of production, a firm can benefit by specializing its managerial department. Each department is under the charge of an expert. A small firm cannot afford this specialization. Experts are able to reduce the costs of production under their supervision.

c) Marketing Economies :
As the scale of a firm increases, internal economies accrue to the firm due to large scale purchases and sales. Since the firm purchases on a large scale, it gets all the inputs at a cheaper rate compared to the smaller firms. Similarly, wholesalers charge less for the sale of products to a large firm.

d) Financial Economies :
A large firm will be able to reduce its costs of borrowing from the market. A bigger firm is better known to the financial institutions and the stock market. Therefore, a big firm has better access to credit and can borrow on more favourable terms.

e) Economies of Welfare :
A big firm employes a large number of workers. Each worker is given the kind of job he is fit for. Therefore, workers get skilled in their operations which save production time and encourage new ideas.

f) Risk-Bearing Economies :
Large firms will be in a position to bear risks or avoid risks. They do so by diversifying output and markets. Therefore, loss in one good or in one market can be covered by profits in other goods or markets.

g) Economies of Research and Development :
Large firms possess more resources than small firms and hence, these firms invest huge amount of money on research and development (R & D). Introduction of innovative methods in production activity due to R & D reduces cost of production and results in internal economies.

Question 7.
What is supply? Explain the determinants supply.
Answer:
The law of supply explains the functional relationship between price of a commodity and its quantity supplied. The law of supply can be stated as follows, “Other things remaining the same, as the price of a commodity rises its supply is extended and as the price falls its supply is contracted”.

The law of supply can be explained with the help of supply schedule and supply curve.

Supply Schedule :
Supply schedule explains various amounts of good that the seller offers for sale at different prices. It represents the functional relationship between price and quantities supplied. There is direct relationship between price and supply. This can be shown in the following schedule.

Price (in ₹)Quantity supplied
5.001000
4.00800
3.00600
2.00400
1.00200

The above schedule high price, i.e, ₹ 5.00 per unit, 1000 units are supplied and at ₹ 1 per unit, 200 units are supplied. It means high price indicate high supply and low price indicates low supply. So, it shows the direct relationship between price and supply.

Supply curve :
A supply curve can be drawn with the help of above supply schedule to explain the direct relationship between price and supply.
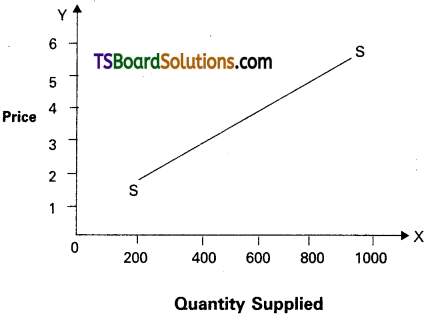
TS Inter 1st Year Economics Study Material Chapter 4 Production Analysis 14

In the above diagram supply is shown on ‘OX’ axis and price is shown on OY axis. SS is supply curve. It slopes upwards from left to right; The slope of supply curve is always positive. Because there is direct relationship between the price and supply.

Determinants of Supply:
1. Price of the Commodity :
The supply of the commodity depends upon the price of that commodity. When price falls, supply falls and when price rises, supply also rises. Thus, price and supply are directly related.

2. Factor Prices :
The cost of production of a commodity depends upon the prices of various factors of production.

3. Prices of Related Goods :
The supply of the commodity depends upon the prices of related goods. If the price of a substitute good goes up, the producer will be induced to divert their resources.

4. State of Technology :
Technological improvements determine supply of a commodity. Progress in technology leads to reduction in the cost of production which will increase supply.

5. Government Policy :
Imposition of heavy taxes as a commodity discourages its production. Hence, production decreases.

TS Inter 1st Year Economics Study Material Chapter 4 Production Analysis

Question 8.
Discuss about the changes in supply.
Answer:
The supply function explains the relationship between the determinants of supply of a commodity and the supply of that commodity. Supply of a commodity depends upon its price, the prices of related goods, the prices of factors of production, the state of technology, the goals of firm and polity of the government. These can be written in the form a supply function as :
Qx = f(Px, Pr, Pf T, Gf, Gp)

Where, Qx = quantity of good X supplied, Px = price of good X, Pr = prices of related goods (substitutes, complementaries), Pf = prices of factors of production, T = technical knowhow, Gf = goal of the firm / seller, Gp = government policy, f = functional relationship.

In the above equation, supply of commodity is a dependent variable on many aspects. Change even in one variable of the determinants of supply brings a change in the supply. In determining the supply of a good, price of this good is more important among all the determinants. Hence, if we assume all other aspects will not change, then the supply function will be as :
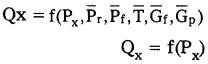
TS Inter 1st Year Economics Study Material Chapter 4 Production Analysis 15

Determinants of Supply :
Supply function explains the relationship between supply

i) Price of a Good :
In determining the supply of a good, price of this good is more important and this price determines the profit of the firm. Other things being constant, the supply of commodity increases with an increase in its price and vice versa. Thus, there exist a positive relationship between price and supply.

ii) Prices of its Related Goods :
Goods comprise substitutes and complementaries. Any change in the prices of these goods exerts influence on production of the good in consideration. For instance, if the price of a substitute good goes up, the producers may try to produce that substitute good or demand for the substitute good which has higher price may decrease and therefore, producer may increase supply of the good which he was producing initially. Similarly, producer may decide the supply of his product on the basis of the prices of complementaries and demand for them.

iii) Prices of Factors of Production :
Increase in the prices of factors of production would lead to an increase in the cost of production. As a result, supply of the commodity may decline. The reverse will happen in the case of a fall in the prices of factors of production.

iv) State of Technology :
New and improved methods of production, inventions and innovations help to save factors, costs and time and thus, technology contributes to increase the supply of goods.

v) Goals of producer and other determinants :
Goals of producer, means of transport and communication and natural factor etc., will equally influence the supply of a commodity.

vi) Government policy :
Imposition of heavy taxes on a commodity discourages the production of goods and as a result supply diminishes in goods are given, supply of goods will increase.

Question 9.
Discuss the types of costs.
Answer:
Cost analysis refers to the study of behaviour of production costs in relation to one or more production criteria, namely size of output, scale of operations, prices of factors of production and other relevant economic variable. In other words, cost analysis is concerned with financial aspects of production relations as against physical aspects considered in production analysis. A useful cost analysis needs a clear understanding of the various cost concepts which are dealt here under.

Types of Costs :
Broadly, types of costs can be classified into three types, namely, money costs, real costs and opportunity costs.

1) Money Costs :
The money spent by a firm in the process of production of its output is money cost. These costs would be in the form of wages and salaries paid to labour, expenditure on machinery, payment for materials, power, light, fuel and transportation. These costs are further divided into explicit costs and implicit costs. The amount paid to all factors of production hired from outside by the producer is called as explicit cost. And the amount of own resources and services applied by the producer in the production process is called as implicit cost.

2) Real Costs :
According to Alfred Marshall, “the pains and sacrifices made by labourers and entrepreneurs / organizers in the process of production activity are real costs”. The amount of crop (produce) sacrificed by the landlord by giving his land to tenants, the amount of leisure sacrificed by the labourer in extending labour to produce goods, the amount of consumption sacrificed by the investor by saving his money for investment are some of the examples of real costs.

3) Opportunity Costs :
It is also called as alternative cost or economic cost. Opportunity cost is next best alternative of factors of production. The alternate uses capacity of factors of production signifies opportunity costs. If a factor possesses alternative uses, the factor can be used only in one activity by forgoing other possibilities. In other words, opportunity cost is nothing but next best alternative foregone by a factor. For example, if a farmer decides to grow wheat instead of rice, the opportunity cost of the wheat would be the rice, which he might have grown rather. Thus, opportunity cost is the cost of foregone alternative.

Short-Run Cost Curve analysis :
In shortrun, the costs faced by a firm can be classified into fixed and variable costs.

4) Fixed Costs :
The fixed costs of a firm are those costs that do not vary with the size of its output. It is due to this, the value of fixed cost is always positive even if production activity does not take place or it is zero. The best way of defining fixed costs is to say that they are the costs which a firm has to bear even when it is temporarily shut down. Alfred Marshall called these costs as ‘Supplementary costs’ or ‘Overhead costs’. E.g.: costs of plant and equipment, rent on buildings, salaries to permanent employees are part of fixed costs.

5) Variable Costs :
On the other hand, Variable costs are those costs which change with changes in the volume of output. Marshall called these costs as ‘prime costs’. Daily wages to employees, payments to raw materials, fuel and power, excise taxes, interest on short-term loans etc., are examples for variable costs.

TS Inter 1st Year Economics Study Material Chapter 4 Production Analysis

Question 10.
Explain the relationship between total cost, total variable cost and total fixed cost.
Answer:
In short-run, the costs faced by a firm can be classified into fixed and variable costs.

1) Fixed Costs and Variable Costs :
The fixed costs of a firm are those costs that do not vary with the size of its output. It is due to this, the value of fixed costs is always positive even if production activity does not take place or it is zero. The best way of defining fixed costs is to say that they are the costs which a firm has to bear even when it is temporarily shut down. Alfred Marshall called these costs as ‘Supplementary costs’ or ‘Overhead costs’. E.g.: costs of plant and equipment, rent on buildings, salaries to permanent employees are part of fixed costs. On the other hand, variable costs are those costs which change with changes in the volume of output. Marshall called these costs as ‘Prime costs’. Daily wages to employees, payment to raw materials, fuel and power, excise taxes, interest on short-term loans etc., are examples for variable costs.

2) Nature of short run Cost Curves :
As mentioned earlier, short-run is a period of time within which the firm can vary its output by varying only variable factors of production. The fixed factors such as capital equipment, top management personnel etc., cannot be varied. Therefore, short-run cost structure of a firm reveals fixed costs and variable costs, Total Cost (TC), Total Fixed Costs (TFC), Total Variable Costs (TVQ, Total Average Costs (SAC) and Marginal Costs (SMC). But in the long-run, all costs are variables. The nature of short-run costs and the curvature of these costs are explained by using table and figure.

In table, short-run costs faced by a firm are analyzed. As mentioned earlier, total fixed cost is the cost of fixed factors which remains constant irrespective of level of output. It is at ₹ 300/- Total variable cost, on the other hand, implies expenses on variable factors of production. It is zero when output is nothing or zero and goes on increasing along with the level of output. Total cost is the sum of total fixed cost and total variable cost i.e., TC = TFC + TVC. Though TFC remains constant, TVC increase along with the level of output, TC also increases if TVC increases. A description of the relationship between these three curves is presented in figure.
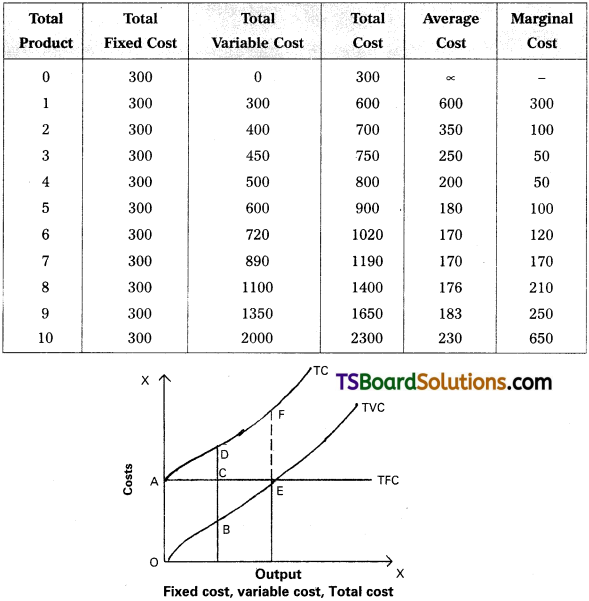
TS Inter 1st Year Economics Study Material Chapter 4 Production Analysis 16

Question 11.
Explain the relationship between Average Cost and Marginal Cost.
Answer:
Cost analysis refers to the study of behavior of production costs in relation to one or more production criteria, namely, size of output, scale of operations, prices of factors of production and other relevant economic variables. In other words, cost analysis is concerned with financial aspects of production relations as against physical aspects considered in production analysis. A useful cost analysis needs a clear understanding of the various cost concepts which are dealt hereunder.

Relationship Between Average Cost and Marginal Cost :
Average cost (AC) is the sum of Average Variable Cost (AVC) and Average Fixed Cost (AFC). It is total cost divided by the number of units produced. In short, cost per unit is known as Average Cost (AC). AC = TC / Q = TFC / Q + TVC / Q = AFC + AVC. Marginal Cost (MC) is the addition made to the total cost by the production of additional units of output. It is the change in total cost associated with a change in output. We can therefore, write MC = Change in Total Cost / Change in Output = ∆TC / ∆Q or MCn = TCn – TCn-1

As per the nature of costs, both AC and MC curves gradually decrease, reach to mini-mum and gradually increase thereafter along with increase in level of output. It is to be noted that both AC and MC curves will have ‘U’ shape implying three phases i.e., decreasing, minimum (constant) and increasing. This is shown with the help of the following diagram.
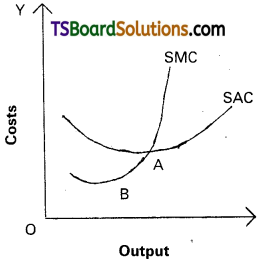
TS Inter 1st Year Economics Study Material Chapter 4 Production Analysis 17

By the figure, output is measured on OX axis and costs on OY axis. It can be seen from this graph that in the beginning as output increases, both AC and MC decrease but the rate of decrease in MC is more than the decrease in AC. At point A, AC = MC and after this point both AC and MC increase but rate of increase in MC is greater than the rate of increase in AC.

Properties of AC and MC :

  1. Both AC and MC curves are U shaped.
  2. As output increases, both AC and MC decrease in the beginning.
  3. MC curve cuts AC curve from its minimum points, at which point AC = MC.
  4. Both AC and MC increase after certain level of output.

Question 12.
Explain diagramatically the nature of average revenue and marginal revenue under perfect competition and monopoly.
Answer:
The amount of money that the producer receives in exchange for the goods (sale proceeds) is called producer’s receipts or revenue. In other words, the total sale proceeds of a firm are known as revenue. We can conceive three types of revenue. They are : total revenue, average revenue and marginal revenue.

a) Total Revenue (TR) :
Total amount of money or income received by the firm from the sale of a certain quantity of output is called total revenue. It is obtained by multiplying the price of a commodity by the number of units sold, i.e., TR = PQ.
Where, P = Price of the good and Q = the quantity of the good sold.

b) Average Revenue (AR) :
Average revenue is the revenue per unit of goods sold. It is computed by dividing the total revenue by the number of the units of a good sold. Thus, AR = TR / Q = PQ / Q = P. It is clear from the above formula that the average revenue at each level of output is equal to the price per unit.

c) Marginal Revenue (MR) :
It is the net addition to the total revenue by selling additional units of the goods i.e., the revenue which would be earned by selling an additional unit of the good. Marginal revenue can be expressed as : MR = ∆TR / ∆Q, where, ∆TR = change in total revenue and ∆Q = change in quantity. In other form, MRn = TRn – TRn-1.

AR and MR Curves under Perfect Competition:
Under perfect competition, there exist large number of sellers and large number of buyers. The sellers under this competition offer homogenous products and, therefore, neither sellers nor buyers have any control on the price of the product. The seller can sell any amount of the good and buyers can buy any amount of the good at the ruling market price. In this case, total revenue (TR), average revenue (AR) and marginal revenue (MR) of a perfectly competitive firm are analyzed here under using table and diagram.
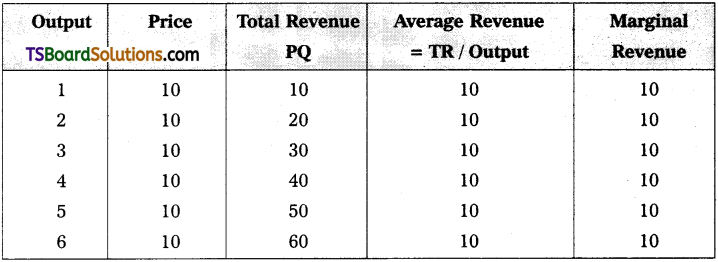
TS Inter 1st Year Economics Study Material Chapter 4 Production Analysis 18

Since the price of the product remains constant under perfect competition, the output sold increases and therefore, revenue also increases. Due to homogeneity, the goods are sold at single price under perfect competition therefore, additional units are also sold at the same price. Hence, under this competition, the AR equals MR all through. Because of this, P = AR= MR. The nature of AR and MR curves is shown with the help of figure.

By the diagram, output is measured on OX axis and price / AR / MR on OY axis. OP price in the diagram indicates existence of single price. Since, P = AR = MR, the AR and MR curves will be parallel to OX axis as shown in figure.
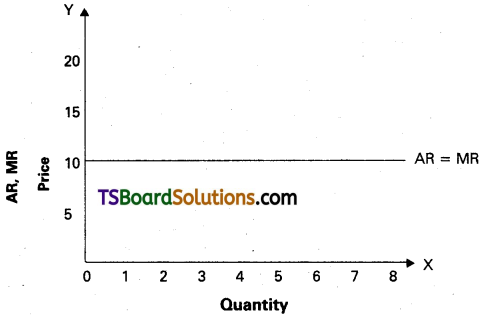
TS Inter 1st Year Economics Study Material Chapter 4 Production Analysis 19

AR and MR Curves under Monopoly :
Under monopoly, there is a single seller. The commodity offered by a monoplist may be or may not be homogenous. Monopolist can control price and output of the commodity, but he can’t determine both simultaneously due to existence of left to right downward sloping demand curve in the market. He can sell more quantity at lower price and less quantity at higher price. The relationship between TR, AR and MR is shown in table.
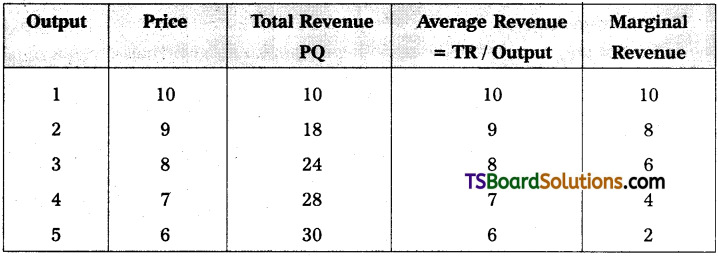
TS Inter 1st Year Economics Study Material Chapter 4 Production Analysis 20

The table reveals that as price falls, sales may improve and total revenue also increases but average revenue (AR) and marginal revenue falls continuously. Here, MR declines at faster rate than that of AR. Thus, MR curve lies below the AR as shown in the figure.
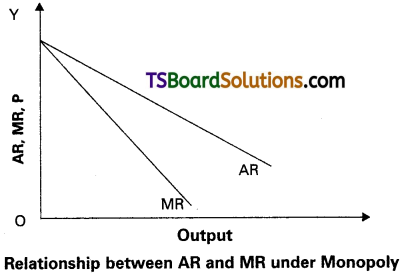
TS Inter 1st Year Economics Study Material Chapter 4 Production Analysis 21

In figure, AR and MR represent average revenue and marginal revenue curves respectively. The monopolist can sell higher quantity at lower price and therefore, always AR is greater than MR. Thus, curve lies above MR curve.

Very Short Answer Questions

Question 1.
Explain the Characteristics of land.
Answer:
Land means not only earth’s surface alone but also refers to all free gits of nature which include soil, water, air, natural vegetation etc.

Characteristics of Land – The following are the characteristics of land as a factor of ‘ production
a) Free gift of nature.
b) Supply of land is perfectly inelastic.
c) Cannot be shifted from one place to another place.
d) Land provides infinite variation of degree of fertility.

TS Inter 1st Year Economics Study Material Chapter 4 Production Analysis

Question 2.
What is Division of Labour?
Answer:
It is an important feature of modern industrial organisation. It refers to scheme of dividing the given activity among workers in such a way that each worker is supposed to do one activity or only a limited and narrow segment of an activity. Thus, division of labour increases output per worker on account of higher efficiency and specialised skill.

Question 3.
Define the Production Function.
Answer:
The production function is the relationship between the physical inputs and the physical outputs of a firm. Production of a firm, production function explains the functional relationship between inputs and outputs this can be as follows Gx = f (L, K, R, N, T).

Question 4.
Explain the concepts of Average Productand Marginal product
Answer:
It is the additional product by employing an additional labour.
MP = \(\frac{\Delta \mathrm{TP}}{\Delta \mathrm{L}}\)

It refers to the product per unit of labour it is obtained by dividing total product by the number of labourers employed.
Ap = \(\frac{TP}{L}\)

Question 5.
Explain the classification of Factors of production.
Answer:
Factors that help in the production process are called factors of production.
Ex : land, labour, capital and organization.

Question 6.
Explain the Technical economies.
Answer:
It is one of the internal economies.

The large firms will have more resources at their disposal. Hence, these firms can install the most suitable machinery. As a result larger firms experience lower cost of production. There are four different ways in which technical economies can arise.
a) Large size machines.
b) Linking processes.
c) Superior techniques.
d) Increased specialization.

Question 7.
What is the Importance of capital?
Answer:
Importance of Capital: The importance of capital in brief :

  1. Capital plays a very vital role in the modem productive system. Production without capital is almost impossible.
  2. The productivity of workforce depends upon the amount of capital available per worker. The greater the capital per worker, the greater the efficiency and productivity of the worker.
  3. Capital occupies a central position in the process of economic development.
  4. It promotes the technological progress.
  5. It helps in the creation of employment opportunities.

Question 8.
Explain the External Economies.
Answer:
External economies are those economies which accure to each member firm as a result of the expension of the industry as a whole as the name tells us, these economies are common in nature which benefit all the firms working in an exponding industry external economies are as follows.
a) Economies of concentration.
b) Economies of information.
c) Economies of specialisation
d) Economies of welfare.

TS Inter 1st Year Economics Study Material Chapter 4 Production Analysis

Question 9.
What is Capital Accumlation?
Answer:
Capital accumulation typically refers to an increase in assets from investment or profits. Individuals and companies can accumulate capital through investment. Investment assets usually earn profit they contributes to a capital base.

Question 10.
Define Supply function.
Answer:
Supply of a commodity depends upon a number of factors, the important among these can be presented in the form of a supply function. It explains the functional relationship between supply of a commodity and other determinants of supply of that commodity. This can be explained as follows.
Sx = f(Px, Py, Pf, T Gf, Gp)
Sx = Supply of commodity x
f = Functional relationship
Px’ = Price of good x
Py = Price of related good
Pf = Price of factors
T = Technical progress
Gf = Goal of the producer
Gp = Government policy.

Question 11.
Define Law of supply.
Answer:
The law of supply explains the functional relationship between price of a commodity and its quantity supplied. The law of supply can be stated as follows “Other things remaining the same, as the price of a commodity rises its supply is extended and as the price falls its supply is contracted”.

Question 12.
Explain the Supply schedule and supply Curve.
Answer:
Supply Schedule and Supply Curve :
The supply schedule is a table which explains various amounts of a good that the seller offered for sale at different prices. This table can be explained by the table as price increases from ₹ 30 to ₹ 60, the supply increases from 1,000 kgs to 4,000 kgs. It is to be noted that larger quantites are offered at a higher price than at a lower price.

Price (₹)Quantity Supplied
301,000
402,000
503,000
604,000

Supply Curve :
Supply curve can be derived based on the supply schedule. By the diagram price is shown on Y – axis supply is shown on X – axis SS is the supply curve which slopes upwards from left to right. It implies that as price increases, supply also increases and vice versa. If price increases from p – p1, supply also increases from M to M1 and vice Versa.
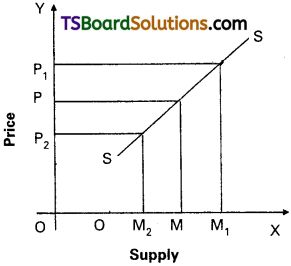
TS Inter 1st Year Economics Study Material Chapter 4 Production Analysis 22

Question 13.
What are Money costs? [Mar.’17]
Answer:
The money spent by a firm in the process of production of its output is money cost. These costs would be in the form of wages and salaries paid to labour, expenditure on machinery, payment for material, power, light, fuel and transportation. These costs are further divided into explicit costs and implicit costs.

TS Inter 1st Year Economics Study Material Chapter 4 Production Analysis

Question 14.
What is an Opportunity cost?
Answer:
Opportunity cost :
It is also called alternative cost or economic cost. Opportunity cost is next best alternative use of factors of production. If a scarce factor possesses alternative uses, the factor can be used only in one activity by foregoing other possibilities. In other words, opportunity cost is nothing but next best alternative foregone by a factor. For example, if a farmer decides to grow wheat instead of rice, the opportunity cost of the wheat would be the rice, which he might have grown rather. Thus, opportunity cost is the cost of foregone alternative.

Question 15.
Describe the Total fixed cost curve.
Answer:
The fixed costs of a firm are those costs that do not vary with the size of its output. It is due to this the value of fixed costs is always positive even if production activity does not take place or it is zero. The best way of defining fixed costs is to say that they are the costs which a firm has to bear even when it is temporarily shut down. Alfred Marshall called these costs as supplementary costs or over head costs. For examples cost of plant and equipment, rent on building, salaries to permanent employees are part of fixed costs.

Question 16.
Explain the relationship between AC and MC.
Answer:
Average cost :
Average Cost (AC) is the sum of the Average Variable Cost (AVC) and Average Fixed Cost (AFC). It is total cost divided by the number of units produced. In short, cost per unit is known as average cost (AC).
AC = TC / Q = TFC / Q + TVC / Q = AFC + AVC.

Marginal Cost :
Marginal Cost (MC) is the addition made to the total cost by the production of additional units of output. It is the change in total cost associated with a change in output. We can therefore, write

MC = Change Total Cost / Change in Output or MCn = TCn – TCn-1.

Question 17.
Explain the nature of AR and MR curves in perfect competition.
Answer:
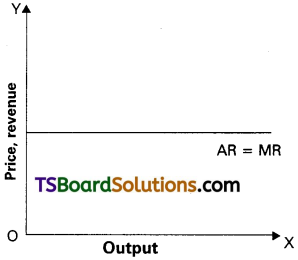
TS Inter 1st Year Economics Study Material Chapter 4 Production Analysis 23
Under perfect competition, there exist large number of sel1 rs and large number of buyers. In this market neither sellers nor buyers have any control on the price of the product. The seller can sell any amout of the good and buyers can buy any amount of the good at the ruling market price. Here the goods are sold at single price under perfect competition therefore, additional units are also sold at the same price. Hence, under perfect competition the AR = MR, because of this P = AR = MR. Since P = At = MR, the AR and MR curves will be parallel to OX axis as shown in the following diagram.

TS Inter 1st Year Economics Study Material Chapter 4 Production Analysis

Question 18.
Explain the nature of AR and MR curves in Monopoly.
Answer:
Under monopoly, there is a single seller. The commodity offered by a monoplist may be or may not be homogenous. Monopolist can control price and output of the commodity, but he can’t determine both simultaneously due to existance of left to right downward sloping demand curve in the market. He can sell more quantity at lower pric e and less quantity at higher price. The relationship between TR, AR and MR is shown in table.
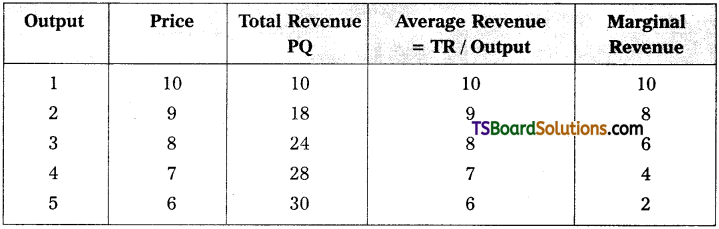
TS Inter 1st Year Economics Study Material Chapter 4 Production Analysis 24

The table reveals that as price falls, sales may improve and total revenue also increases but average revenue (AR) and marginal revenue falls continuously. Here, MR declines at faster rate than that of AR. Thus, MR curve lies below the AR as shown in the figure.


TS Inter 1st Year Economics Study Material Chapter 1 Introduction to Economics

Telangana TSBIE TS Inter 1st Year Economics Study Material 1st Lesson Introduction to Economics Textbook Questions and Answers.

TS Inter 1st Year Economics Study Material 1st Lesson Introduction to Economics

Long Answer Questions

Question 1.
Examine the wealth and welfare definitions of Economics.
Answer:
Wealth Definition :
Adam Smith was the first person to give a precise definition of Economics and separate this study from other social sciences. Adam Smith is considered as ‘Father of Economics’. He defined it in his famous book Wealth of Nations’, as “An enquiry into the nature and causes of wealth of nations”. Most of the economists in the 19th century held this view.

J.B. Say states that “The aim of political economy is to show the way in which wealth is produced, distributed and consumed”. The other economists who supported this definition are J.B. Say, J.S. Mill, Walker and others.

The main features of Wealth definition :

  1. Acquisition of wealth is considered as the main objective of human activity.
  2. Wealth means material things.
  3. Human beings are guided by self-interest, whose objective is to accumulate more and more wealth.
  4. Economics deals with the activities of wealth production, consumption, preservation and increasing.

Criticism :
The Wealth definition was severely criticised by many writers due to its defects.

  1. Economists like Carlyle and Ruskin pointed out that economics must discuss ordinary man’s activities. So they called it as a ‘Dismal Science’.
  2. In Adam Smith’s definition, wealth was considered to consist of only material things and services are not included. Due to this the scope of economics is limited.
  3. Marshall pointed out wealth is only a means to an end but not an end in itself.
  4. This definition concentrated mainly on the production side and neglected distribution side.

Welfare definition :
Alfred Marshall tried to remedy the defects of wealth definition in 1890. He shifted emphasis from production of wealth to distribution of wealth.

According to Marshall, “Political Economy or Economics is a study of mankind in the ordinary business of life. It examines that part of individual and social action which is most closely connected with the attainment and with the use of material requisites of well-being. Thus, Economics is on one side, a study of wealth and on the other and more important side, a part of study of man”.

Edwin Cannan defined it as “The aim of political economy is the explanation of the general causes on which the material welfare of human beings depends”.

In the words of Pigou, “The range of enquiry becomes restricted to that part of social welfare that can be brought directly or indirectly into relation with the measuring rod of money”.

The main features of Welfare definition :

  1. Economics as a social science is concerned with man’s ordinary business of life.
  2. Economics studies only economic aspects of human life and it has no concern with the social, political and religious aspects of human life. It examines that part of individual and social action which is closely connected with acquisition and use of material wealth for promotion of human welfare.
  3. According to Marshall, the activities which contribute to material welfare are considered as economic activities.
  4. He gave primary importance to man and his welfare and to wealth as means for the promotion of human welfare.

Criticism :

  1. Robbins criticised Marshalls economics as a ’social science’ rather than a human science, which includes the study of actions of every human being.
  2. Marshalls definition mainly concentrated on the welfare derived from material things only. But non – materialistic goods which are also very important for the well being of the people. Hence, it is incomplete.
  3. Critics pointed out that quantitative measurement of welfare is not possible. Welfare is a subjective concept and relative concept and changes according to time, place and persons.
  4. According to Marshall, economics deals with those activities which will promote human welfare. But production of alcohol and drugs do not promote human welfare. Hence, the scope of economics is limited.
  5. Another important criticism is that it is not concerned with the fundamental problem of scarcity of resources. According to Robbins the economic problem arises due to unlimited wants and limited resources. These factors are ignored in this definition.

TS Inter 1st Year Economics Study Material Chapter 1 Introduction to Economics

Question 2.
Critically examine the scarcity definition of economics.
Answer:
Marshall’s Welfare definition until the publication of Lionel Robbins’ book “An Essay on the Nature and Significance of Economic Science” in 1932. Robbins’ definition brought out the logical inconsistencies and inadequacies of the earlier definitions and formulated his own definition of economics. He has given a more scientific definition of economics. In the words of Robbins, “Economics is the science which studies human behavior as a relationship between ends and scarce means which have alternative uses”.

I. Main Features:
1) Human Wants are Unlimited :
The fulfillment of one want gives rise to a number of new wants.

2) Means are Scarce :
The means of a person by which his wants may be satisfied are limited. It leads to economic problems as all wants cannot be satisfied by these limited means.

3) Alternative Uses of Scarce Means :
Resources are not only scare but also have multiple uses. For example electricity can be used in homes and also in industries. A piece of land can be used to produce rice or wheat. If a scarce factor is used for the satisfaction of one want, less of it will be available for other wants. Hence, man has to make a decision regarding the alternative uses of resources.

4) Man has therefore to choose between wants. Problem of choice arises.

II. Superiority of Robbins’ Definition :
Robbins’ definition is superior to the earlier definitions in more than one way. The reasons are given below :

  1. It is non-classificatory, as it includes all human activities whether they promote human welfare or not.
  2. This is a universally accepted definition. It is applicable to all types of societies, because the scarcity of resources is felt by individuals as well as societies.
  3. Robbins’ definition of economics is neutral between ends. Being a positive science it does not pass any value judgments regarding ends.

III. Criticism :
Some followers of Marshall like Durban, Fraser, Beveridge and Wootton have criticised Robbins’ definition by saying that it lacks human touch and that it is personal, neutral and devoid of any normative or ethical element. He does not seek to make economics a study of human welfare. Some of them criticized as “barren scholasticism” while others accused him of “behaviourism”.

  1. Even though Robbins criticized Marshall’s welfare definition, he has introduced the welfare concept indirectly in his definition. Therefore, the criticism of welfare definition is equally applicable to it.
  2. Another criticism of Robbins’ definition is that this definition does not distinguish between ‘ends’ and ‘means’.
  3. Scarcity definition has been criticized by economists as to say “economics is neutral between ends”. But economics cannot be neutral between ends.
  4. Robbins made economics a positive science. As per Macfie, “economics is fundamentally a normative science, not merely positive science like chemistry”.
  5. Robbins’ definition is not applicable to a dynamic society where changes take place and the problem of scarcity of resources can be overcome with the passage of time.
  6. Mrs. Joan Robbinson took serious objection to scarcity of resources. How best you utilize them is more important than the idle resources.
  7. Robbins’ scarcity definition neglects the more important problems of growth and stability.

Question 3.
Explain the nature and scope of Economics.
Answer:
The nature of economics took a definite shape with the writings of Adam Smith, known as Father of Economics, made a beginning in defining economics and its scope with the publication of his famous book on the wealth of nations. Then a number of economists defined economics and its subject matter in different ways.

The scope of any science explains what the science is concerned with. In economics, traditional economic theory is divided into various branches like consmption, production, exchange, distribution, income, employment, planning and development; where as modem economic theory is divided into two branches viz. micro economics and macro economics.

Economics not only explains things as they are, but also elucidates with what it ought to be. For example, economics discuses the existing level of wages, prices and tax rates in the economy and also suggest how they ought to be. Economics is thus, both a positive and normative science.

Traditional economics is basically concerned with consumption, productio, exchange distribution, income, employment, planning and development.

1. Consumption :
Consumption can be defined as ‘extracting utility from goods and services’. Consumption is the act of using final goods and services to satisfy current wants. Consumption is the basis for production, exchange, distribution.

2. Production :
In the economics production is the process of conversion of raw materials into final goods by adding form, place and time utility to the raw materials. The factors which participate in production are called factors of production. They are land, labour, capital and organization.

3. Exchange :
It is concerned with exchange of a good. A good may be exchanged for another good or for money. Before the evolution of money when barter system was in practice, goods were exchanged for goods. There were many problems in barter system. With the introduction of money, value of every good is expressed in terms of money and can be exchanged for money.

4. Distribution :
Distribution is another important activity in economics. It explains how goods and services are distributed amongst the various factors of production which are responsible for the production. Each factor of production gets its reward. Various theories are there to determine the factor prices.

5. Income :
Individuals earn income by participating in various economic activities. The activities are related to production of material goods or the services. Income is a continuous flow. Various concepts of national income and the measuring methods of national income are discussed as part of macro economics for analysing economic growth and development.

6. Employment :
The level of employment in an economy depends on the demand for consumption goods and demand for investment goods. Full employment means employment of all those who are able and willing to work at.the prevailing wage rates.

7. Planning and Economic Development :
Economic planning is essential for proper and efficient utilization of the available resources. By economic planning we mean achieving the various predetermined targets systematically in a specific period of time. Economic planning is the method by which an optimum allocation of scarce resources amongst the various sectors is made in order to acheive speedy development of the economy and improve the welfare of the people.

TS Inter 1st Year Economics Study Material Chapter 1 Introduction to Economics

Question 4.
Explain the concepts and scope of Micro Economics and Macro Economics.
Answer:
Modem economic theory divided it into two branches, namely (i) Micro Economics (ii) Macro Economics. Ragnar Frisch was the first economist to use the words “Micro and Macro” in economic theory in 1930.

Micro Economics :
The term “Micro Economics” is derived from the Greek word MIKROS’ which means small. Thus, micro economics is the theory of small. It was developed by classical economists like Adam Smith, J.B. Say, J.S. Mill, Ricardo, Marshall etc. It studies about individual units or behaviour of that particular units like individual income, price, demand etc. Micro Economics is also known as partial analysis. It mainly,’ concentrates on the determination of prices of commodities and factors of production. It is also known as “Price theory”. According to K.E. Boulding, “Micro Economics is the study of particular firms, particular households, individual prices, wages, incomes individual industries and particular commodities”.

Shapiro says “Micro Economics has got relation with small segments of the society.
TS Inter 1st Year Economics Study Material Chapter 1 Introduction to Economics 1

Macro Economics :
The term Macro Economics is derived from the Greek word ‘MAKROS’ which means large. Thus, Macro Economics is the study of economic system as a whole. It was developed by J.M. Keynes. It studies aggregates in the economy like national income, total consumption, total saving and total employment etc. It is also known as Income and Employment theory.

According to Boulding “Macro Economics studies national income not individual income, general price level instead of individual prices and national output instead of individual output”. Macro Economics also studies the economic problems like poverty, unemployment, economic growth, development etc. It also deals with the theory of distribution.
TS Inter 1st Year Economics Study Material Chapter 1 Introduction to Economics 2

The difference between Micro Economics and Macro Economics :
Micro and Macro Economics are interrelated to each other. Inspite of close relationship between the two branches of economics, fundamentally they differ from each other.

Micro EconomicsMacro Economics
1. The word micro derived from the Greek word ‘Mikros’ means “small”.1. The word macro derived from the Greek word ‘Makros’ which means “large”.
2. Micro Economics is the study of individual units of the economy.2. Macro Economics is the study of economy as a whole.
3. It is known as ‘Price theory’.3. It is known as ‘Income and Employment theory’.
4. Micro Economics explains price de-termination in both commodity and factor markets.4. Macro Economics deals with national income, total employment, general price level and economic growth etc.
5. Micro Economics is based on price mechanism which depends on demand and supply.5. Macro Economics based on aggregate demand and aggregate supply.

TS Inter 1st Year Economics Study Material Chapter 1 Introduction to Economics

Question 5.
Explain the different types of goods.
Answer:
Goods are the articles and services which satisfy a human want like books, pens, cell phones etc. Hence, all tangible things that satisfy human wants are called goods. Goods can be divided into two types : free goods and economic goods.

1. Free Goods :
Goods which are freely supplied by the nature and without prices are known as free goods. The supply of these goods is always abundantly greater than their demand and therefore, do not have any price. Free goods possess only value in use, but no exchange value. Examples are air, water and sunshine. Now-a-days, some of these also became economic goods due to several reasons and these goods are priced.

2. Economic goods :
An economic good is any physical object, natural or man made or service rendered that can be commanded a price in a market. They always fall short of the demand for them. These economic goods have both value in use and value in exchange such as pens, books, laptops, etc. Economic goods possess three important characteristics i.e., utility, scarcity, and transferability. Economic goods are also divided into three types, i.e. consumer, product, and intermediary.

3. Consumer Goods :
A consumer good is an economic good or commodity purchased by households for final consumption. Thus, consumer goods are those goods which directly satisfy human wants. For example fruits, milk, pens, clothes, etc.

4. Producer or Capital Goods :
Goods which are used in the production of other goods are called producer or capital goods. They satisfy human wants indirectly. For example machines, buildings etc. are capital goods. A good can be classified into consumer good or capital good depending on the nature of its use. For example, when paddy is used for food it becomes a consumer good and when used as seed in cultivation, it becomes a capital good.

5. Intermediary Goods :
Goods which are under the process of production and semi finished goods are known as intermediary goods. Examples are cement, bricks and steel used as intermediary goods in construction work. The goods which are not yet finished and under different stages of production are known as intermediary goods.

Short Answer Questions

Question 1.
Examine the welfare definition of economics.
Answer:
Alfred Marshall raised economics to a dignified status by advancing a new definition in 1890. He shifted emphasis from production of wealth to distribution of wealth (welfare). In the words of Marshall, “political economy or economics is a study of mankind in the ordinary business of life; it examines that part of individual and social action which is most closely connected with the attainment and with the use of the material requisites of well – being. Thus, it is on the one side, a study of wealth and on the other and more important side, a part of the study of man”.

I. Important Features of Welfare Definition :

  1. Marshall used the term “Economics” for “Political economy” to make it similar to physics. He assumed that economics must be a science even though it deals with the ever changing forces of human nature.

  2. Economics studies only economic aspects of human life and it has no concern with the political, social and religious aspects of life. It examines that part of individual and social action which is closely connected with acquisition and use of material wealth which promotes human welfare.

  3. Marshall’s definitions considered those human activities which increased welfare.

  4. This definition has given importance to man and his welfare and recognised wealth as a mean for the promotion of human welfare.

II. Criticism:
Marshall’s definition is not free from critics. Robbins in his “Essay on the Nature and Significance of Economic Science” finds fault with the welfare definition of economics.

  1. Economics is a human science rather than a social science. The fundamental laws of economics apply to all human beings and therefore, economics should be treated as a human science and not as a social science.
  2. Lionel Robbins criticized it as classificatory. It distinguishes between materialistic and non materialistic goods and not given any importance to non-materialistic goods which are also very important. Therefore, it is incomplete.
  3. Another serious objection is about the quantitative measurement of welfare. Welfare is a subjective concept and changes according to time, place and persons.
  4. Marshall includes only those activities which promote human welfare. But the production of alcohol and drugs do not promote human welfare. Yet economics deals with the production and consumption of those goods.
  5. Robbins has taken serious objection for not considering ‘scarcity of resources’. According to Robbins’ economic problem arises due to limited resources which are to be used to satisfy unlimited wants.

TS Inter 1st Year Economics Study Material Chapter 1 Introduction to Economics

Question 2.
Explain the scarcity definition of economics.
Answer:
Marshall’s welfare definition until the publication of Lionel Robbins’ book “An Essay on the Nature and Significance of Economic Science” in 1932. Robbins’ definition brought out the logical inconsistencies and inadequacies of the earlier definitions and formulated his own definition of economics. He has given a more scientific definition of economics. In the words of Robbins, “Economics is the science which studies human behavior as a relationship between ends and scarce means which have alternative uses.”

I. Main Features :
1. Human Wants are Unlimited :
The fulfillment of one want gives rise to a number of new wants.

2. Means are Scarce :
The means of a person by which his wants may be satisfied are limited. It leads to economic problems as all wants cannot be satisfied by these limited means.

3. Alternative Uses of Scarce Means :
Resources are not only scarce but also have multiple uses. For example, electricity can be used in homes and also in industries. A piece of land can be used to produce rice or wheat. If a scarce factor is used for the satisfaction of one want, less of it will be available for other wants. Hence, man has to make a decision regarding the alternative uses of resources.

4. Man has, therefore, to choose between wants. Problem of choice arises.

II. Superiority of Robbins’ Definition :
Robbins’ definition is superior to the earlier definition in more than one way. The reasons are given below :

  1. It is non-classificatory, as it includes all human activities whether they promote human welfare or not.
  2. This is universally accepted definition. It is applicable to all types of societies, because the scarcity of resources is felt by individuals as well as by societies.
  3. Robbins’ definition of economics is neutral between ends. Being a positive science it does not pass any value judgements regarding ends.

Question 3.
Explain the growth definition of economics.
Answer:
In the words of Samuelson, “Economics is the study how people and society choose, with or without the use of money, to employ scarce and productive resources which could have alternative uses, to produce various commodities over time and distribute them for consumption, now and in the future, among various people and groups in the society. It analyses the benefits of improving patterns of resource allocation”.

1. Important Points
Some of the important points in Samuelsons’ definition are :

  1. His definition like Robbins agreed that resources are not only limited but also have several uses.
  2. Samuelson’s definition is dynamic in nature as it considers both the present and future consumption, production and distribution.
  3. Growth definition deals with the problem of choice in a dynamic society. Hence, this definition broadened the scope of economomics.
  4. Samuelson’s definition is superior to that of Robbins’ because he shifted the emphasis from the scarcity of resources to income, output and employment and later to the problems of economic growth.

Samuelson’s definition appears to be the most acceptable at the moment.

Question 4.
Explain the fundamental problems of an economy.
Answer:
Fundamental Problems of an Economy

There are certain fundamental problems in any type of economy with which economists are concerned. The following are the basic economic problems. These are interrelated and interdependent.

  1. What type of goods are to be produced and in what quantities?
  2. How to produce these goods?
  3. For whom to produce these goods and services?
  4. How efficient the productive resources are in use? Whether available resources are fully utilized?
  5. Is the economy growing or static over a period of time?

Question 5.
What is Micro Economics? What is its importance?
Answer:
The term ‘Micro Economics’ is derived from the Greek word ‘MIKROS’ which means ‘small’. Thus, Micro Economics deals with individual units like individual demand, price, supply etc. It was popularised by Marshall It is also called as ‘Price Theory’ because it explains pricing in product market as well as factor market.
TS Inter 1st Year Economics Study Material Chapter 1 Introduction to Economics 3

Importance :

  1. Micro Economics provides the basis for understanding the working of the economy as a whole.
  2. This study is useful to the government to frame suitable policies to active economic growth and stability.
  3. This study is applicable to the field of international trade in the determination of exchange rates.
  4. Micro Economics provides an analytical tool for evaluating the economic policies of the government.
  5. It can be used to examine the condition of economic welfare and it suggests ways and means to bring about maximum social welfare.

Question 6.
Explain the concept of Macro Economics, and its Importance.
Answer:
The term Macro Economics is derived from the Greek word ‘MAKROS’ which means large. It was developed by J.M. Keynes. Macro Economics deals with economic system as a whole like national income, aggregate demand, aggregate supply, general price level etc. It is also known as Income and Employment’ theory.
TS Inter 1st Year Economics Study Material Chapter 1 Introduction to Economics 4

Importance :

  1. Macro Economics study is more useful to the government for formulation and execution of policies for achievement of maximum social benefit.
  2. It helps in understanding the problems of unemployment, poverty, inflation etc, and suggests how to solve them.
  3. It gives us a picture of the working of the economy as a whole.
  4. The study of Macro Economics is helpful in analysing the causes of business cycles and in providing remedies.
  5. Macro Economics includes economic growth and suggests how developing countries can use their resources to maximise their growth.
  6. Macro Economic study is useful for making international comparisons in terms of average national income.

Question 7.
Distinguish between Microeconomics and Macroeconomics.
Answer:
Differences between Microeconomics and Macroeconomics

MicroeconomicsMacroeconomics
1. The word mikro derived from the Greek word “micros” means “small”.1. The word makro derived from the Greek word “macros” means “large”.
2. Microeconomics is the study of individual units of the economy.2. Macroeconomics is the study of economy as a whole.
3. It is known as ‘price theory’.3. It is known as ‘income and employment theory’.
4. It explains price determination in both commodity and factor markets.4. It deals with national income, total employment, aggregate savings and investment, general price level and economic development etc.
5. It is based on price mechanism which depends on demand and supply.5. It is based oh aggregate demand and aggregate supply.
6. It is based on partial equilibrium analysis which explains the equilibrium of an individual unit.6. It is based on general equilibrium analysis which explains the simultaneous equilibrium in all the sectors of the economy.
7. It is a static analysis without time element.7. It is a dynamic analysis with time element.

TS Inter 1st Year Economics Study Material Chapter 1 Introduction to Economics

Question 8.
Explain the differences between free goods and Economic goods.
Answer:
Differences between Microeconomics and Macroeconomics

Free GoodsEconomic Goods
1. free goods are nature’s gift.1. Economic goods are man made.
2. Their supply is abundant.2. Supply is always less than their demand.
3. They do not have price.3. These goods have prices.
4. There is no cost of production.4. These goods have cost of production.
5. They have value in use and do not have value in exchange.5. These goods have value in use and also value in exchange.
6. Their values are not included in national income.6. Their values are included in national income.

Question 9.
What is utility? What are its types?
Answer:
The want satisfying capacity of a commodity at a point of time is known as utility. Types of Utility:
1) Form Utility :
Form utilities are created by changing the shape, size and colour etc., of a commodity so as to increase its want satisfying power.
Ex : Conversion of a wooden log into a chair.

2) Place Utility :
By changing the place some goods acquire utility.
Ex : Sand on the sea shore has no utility. If it is brought out and transported to market, it gains utility. This is place utility.

3) Time Utility :
Time utilities are created by storage facility.
Ex : Business men store food grains in the stock points in the off season and releases them to markets to meet high demand and obtain super normal profits.

4) Service Utility :
Services also have the capacity to satisfy human wants.
Ex: Services of Lawyer, Teacher, Doctor etc. These services directly satisfy human wants. Hence, they are called as service utilities.

Question 10.
Analyse the characteristics of wants. [Mar. 17]
Answer:
Human wants are starting point of all economic activities. They depend on social and economic conditions of individuals.
Characteristic features of wants :
1) Unlimited wants :
Human wants are unlimited. There is no end to human wants. When one want is satisfied another want takes its place. Wants differ from person to person, time to time and place to place.

2) A Particular Want is Satiable :
Although a man cannnot satisfy all his wants, a particular want can be satisfied completely in a period of time.
Ex : If a person is thirsty he can satisfy it by drinking a glass of water.

3) Competition :
Human wants are unlimited. But the means to satisfy therr are limited of scarce. Therefore, they complete with each other in priority of satisfaction.

4) Complementary :
To satisfy a particular want we need a group of commodities at the same time.
Ex : Writing need is satisfied only when we have pen, ink and paper together.

5) Substitution :
Most of our wants can be satisfied by different ways.
Ex : If we feel hungry, we can eat rice or fruits satisfy this want.

6) Recurring :
Many wants appear again and again though they are satisfied at one point of time.

7) Habits :
Wants change into habits, which cannnot be given up easily.
Ex : Smoking cigarettes for joke results into a habit if it is not controlled.

8) Wants vary with time, place and person :
Wants go on changing with the passage of time. They are changing from time to time, place to place and person to person. Human wants are divided into

  1. Necessities,
  2. Comforts and
  3. Luxuries.

Very Short Answer Questions

Question 1.
Explain the wealth definition.
Answer:
Wealth means stock of assets held by an individual or institution that yields has the potential for yielding income in some form. Wwalth includes money, shares of companies, land etc. Wealth has three properties. 1. Utility 2. scarcity 3. Transferability.

TS Inter 1st Year Economics Study Material Chapter 1 Introduction to Economics

Question 2.
What is Micro Economics?
Answer:
The word Micro’ is derived from Greek word ‘Mikros’ which means ‘small’. It was devel-oped by Marshall. It is the study of the individual units like individual demand, price, supply etc.

Question 3.
What is Macro Economics?
Answer:
The word Macro’ is derived from Greek work ‘Makros’ which means ‘Large’. It was developed by J.M. Keynes. It studies aggregates or economy as a whole like national income, employment, general price level etc. It is also called “Income and Employment” theory.

Question 4.
What is Positive Economics?
Answer:
A positive science is defined as a body of systematised knowledge concerning ‘what it is’. The classical school economists were of the opinion that economics is purely a positive science which had no right to comment upon the rightness or wrongness of economic policy. Here, economists cannot give any final judgement on any matter.

Question 5.
What is Normative Economics?
Answer:
Normative economics may be defined as a body of systematised knowledge relating to the object of “what ought to be’ and concerned with the ideal as distinguished from the actual. Historical school of Germany has introduced this in Economics.

Question 6.
What are Free goods?
Answer:
Anything which satisfy human want is known as good. Goods which are freely supplied by the nature and without prices are known as free goods. The supply of these goods is always abundantly greater thatn their demand. Hence, they do not command price. Free goods possess only value-in-use, no value-in-exchage. For example, air, water, sunshine.

Question 7.
Explain Economic goods.
nswer:
Economic goods are man made, they have cost of production and price. They are limited in supply. They have both value in use and value in exchange. Ex : Pen, Book etc.

TS Inter 1st Year Economics Study Material Chapter 1 Introduction to Economics

Question 8.
Explain the Consumer Goods.
Answer:
Consumer good is an economic good or commodity purchased by households for final consumption. Thus, consumer goods are those goods which directly satisfy human wants. For Ex : Fruits, Milk, Pen, Clothes etc. Consumer goods are divided into two types.
a) Perishable goods – Which loose their value in single use, Ex : Milk, fruits etc.
b) Durable goods – Which yields service over time. Ex : TVs & Computers.

Question 9.
Explain the Capital Goods.
Answer:
Goods which are used in the production of other goods are called producer or capital goods. They satisfy human wants indirectly. Ex : Machines, tools, buildings etc.

Question 10.
What are single use and durable use goods?
Answer:
Single use capital Goods :
There goods are used only once in the production process. For Example : Raw materials coal and Electricity.

Durable use capital Goods :
These goods are used for long time in the process of production. Machines, tools etc., are the durable capital Goods.

Question 11.
What is Wealth?
Answer:
Wealth means stock of assets held by an individual or institution that has the potential for yielding income in some form. Wealth includes money, shares of companies, land etc. Wealth has three properties. 1. Utility 2. Scarcity 3. Transferability.

Question 12.
What is Income concept?
Answer:
Income is a flow of satisfaction from wealth per unit of time. In every economy income flows from households to firms and vice versa. Income can be expressd in two types.

  1. Money income which is in terms of money.
  2. Real income which is in terms of goods and services.

Question 13.
Explain Value in use concept.
Answer:
The value of any good or service is the power to command other article or service in exchange. Value’ in economics is classified into two concepts. They are;

Value in Use :
It refers to the capacity of the good to satisfy human wants. Free goods have value in use and they do not have any value in exchange. For example, water has a greater value in use but no value in exchange.

Question 14.
Explain value in exchange concept.
Answer:
Exchange value is the purchasing power of one commodity for another. Only economic goods have exchange value.

TS Inter 1st Year Economics Study Material Chapter 1 Introduction to Economics

Question 15.
What is the Price?
Answer:
The price of anything is its value measured in terms of money
Ex: A commodity is exchanged for 50 rupees then the price of a commodity is 50 rupees.

TS Inter 1st Year Economics Study Material Chapter 8 Theories of Employment and Public Finance

Telangana TSBIE TS Inter 1st Year Economics Study Material 8th Lesson Theories of Employment and Public Finance Textbook Questions and Answers.

TS Inter 1st Year Economics Study Material 8th Lesson Theories of Employment and Public Finance

Long Answer Questions

Question 1.
Critically examine the classical theory of employment.
Answer:
The theory of output and employment developed by economists such as Adam Smith, David Ricardo, Malthus is known as classical theory. It is based on the famous “Law of markets” advocated by J.B. Say. According to this law “supply creates its own demand”. The classical theory of employment assumes that there is always full employment of labour and other resources. The classical economists ruled out any general unemployment in the long run. These views are known as the classical theory of output and employment.

The classical theory of employment can be three dimensions.
TS Inter 1st Year Economics Study Material Chapter 8 Theories of Employment and Public Finance 1
C. Equilibrium of the labour market (Pigou wage cut policy)

A) Goods market equilibrium :
The 1st part of Say’s law of markets explains the goods market equilibrium. According to Say “supply creates its own demand”. Say’s law states that supply always equals demand. Whenever additional output is produced in the economy, the factors of production which participate in the process of production. The total income generated is equivalent to the total value of the output produced. Such income creates additional demand for the sale of the additional output. Thus there could be no deficiency in the aggregate demand in the economy for the total output. Here every thing is automatically adjusting without need of government intervention.

The classical economists believe that economy attains equilibrium in the long run at the level of full employment. Any disequilibrium between aggregate demand and aggregate supply equilibrium adjusted automatically. This changes in the general price level is known as price flexibility.

B) Money market equilibrium :
The goods market equilibrium leads to bring equilibrium of both money and labour markets. In goods market, it is assumed that total income spent the classical economists agree that part of the income may be saved. But the savings is gradually spent on capital goods. The expenditure on capital goods is called investment. It is assumed that equality between savings and investment is brought by the flexible rate of interest. This can be explained by the following diagram.
TS Inter 1st Year Economics Study Material Chapter 8 Theories of Employment and Public Finance 2

In the diagram savings and investment are measured on the ‘X’ axis and rate of interest on Y axis. Savings and investments are equal at ‘Oi’ rate of interest. So money market equilibrium can be automatically brought through the rate of interest flexibility.

C) Labour market equilibrium :
According to the classical economists, unemployment may occur in the short run. This is not because the demand is not sufficient but due to increase in the wages forced by the trade unions. A.C. Pigou suggests that reduction in the wages will remove unemployment. This is called wage – cut policy. A reduction in the wage rate results in the increase in employment.
TS Inter 1st Year Economics Study Material Chapter 8 Theories of Employment and Public Finance 3

According to the classical theory supply of and demand for labour are determined by real wage rate. Demand for labour is the inverse function of the real wage rate. The supply of labour is the direct function of real wage rate. At a particular point real wage rate the supply of and the demand for labour in the economy become equal and thus equilibrium attained in the labour market. Thus there is full employment of labour. This can be explained with the help of diagram.

In the above diagram supply of and demand for labour is measured on the X – axis.

The real wage rate is measured on the Y axis.

If the wage rate is OWp the supply of labour more than the demand for labour. Hence the wage rate falls. If the real wage rate is 0W2, the demand for labour is more than supply of labour. Hence the wage rate rises. At OW, real wage rate the supply and demand are equal. This is equilibrium.

Assumptions :

  1. There is no interference of government of the economy.
  2. Perfect competition in commodity and labour market.
  3. Full employment.

TS Inter 1st Year Economics Study Material Chapter 8 Theories of Employment and Public Finance

Question 2.
Explain the Keynesian theory of employment. [Man’17, ’16]
Answer:
Keynes theory of employment is the principle of effective demand. He called his theory, general theory because it deals with all levels of employment. Keynes explains that lack of aggregate demand is the cause of unemployment. He used the terms aggregate demand, aggregate supply. It means total. The term effective demand is used to denote that level of aggregate demand which is equal to aggregate supply.

According to Keynes where aggregate demand and aggregate supply are intersected at that point effective demand is determined. This effective demand will determine the level of employment.

Aggregate supply schedule :
The aggregate supply schedule shows the various amounts of the commodity that will be offered for sale at a series of price. As the level of output increases with the level of employment. The aggregate supply price also increases with every increase in the level of employment. The aggregate supply curve slopes upwards from left to right. But when the economy reaches the level of the full employment, the aggregate supply curve becomes vertical.

Aggregate demand schedule :
The various aggregate demand prices at different level of employment is called aggregate demand price schedule. As the level of employment rises, the total income of the community also rises and therefore the aggregate demand price also increases. The aggregate demand curve slopes upward from left to right.

Equilibrium level of income :
The two determinants of effective demand aggregate supply and aggregate demand prices combined schedule is shown in the following table.

Level of employment
(in lakhs of workers)
Aggregate supply price
(in crores of ₹)
Aggregate demand price
(in crores of ₹)
20200175
30250225
40300300 AD = AS
50350325
60400425

The table shows that so long as the demand price is higher than the aggregate supply price. The level of employment 40 lakh workers aggregate demand price is equal to aggregate supply price i.e., 300 crores. So effective demand in the above table is ₹ 300 crores. This can be shown in the following diagrams.
TS Inter 1st Year Economics Study Material Chapter 8 Theories of Employment and Public Finance 4

In the diagram ‘X’ axis represents the employment and Y axis represents price. A.S is aggregate supply curve A.D is aggregate demand curve. The point of intersection between the two ‘E1‘ point. This is effective demand where all workers are employed at this point the entrepreneurs expectation of profits are maximised. At any other points the entrepreneurs will either incur losses or Employment earn sub-normal profits.

Question 3.
Discuss the concept of public finance. Describe the sources of public revenue.
Answer:
Public finance deals with the income and expenditure of public authorities (government). The word public is used to denote state or government: central, state and local bodies. According to Prof. Hugh Dalton “it is concerned with the income and expenditure of public authorities and with the adjustment of one to another”.

Modem governments play a major role in creating economic and social infrastructure. They spend lots of money on construction of roads, railways, on creating communication systems, education and health, on providing irrigation facilities and electricity etc. Of late modem governments have been spending huge amounts on various welfare measures to ameliorate the difficulties of poor and downtrodden sections of their population.

Public Revenue:
As explained in the previous paragraphs, a modem government has many functions to perform. It needs huge revenue for the performance of all its functions efficiently. Therefore it collects revenue by imposing taxes and also receives money from the people in many other forms. Revenue received by the government from different sources is called public revenue. Public revenue is broadly classified into two kinds :

  1. Tax revenue and
  2. Non-Tax revenue.

1) Tax Revenue :
Revenue received through collection of taxes from the public is called tax revenue. Both the central and state governments collect taxes as per their allocation in the Constitution.

Broadly taxes are divided into two categories : a) direct taxes, b) indirect taxes.
a) Direct Taxes :
i) Taxes imposed on individuals and companies based on income and expenditure.
Ex : Personal income tax, corporate tax, interest tax and expenditure tax.

ii) Taxes imposed on property and capital assets of individuals and companies.
Ex : Wealth tax, gift tax, estate duty.

b) Indirect Taxes :
Taxes levied On goods and services. Ex : Excise duty, customs duty, service tax.

2) Non – Tax Revenue :
Government receives revenue from sources other than taxes and such revenue is called the non-tax revenue. The sources of non-tax revenues are as follows:
a) Administrative Revenue :
Government receives money for certain administrative services. Ex : License fee, Tuition fee, Penalty etc.

b) Commercial Revenue :
Modern governments establish public sector units to manufacture certain goods and offer certain services. The goods and services are exchanged for the price. So such units earn revenue by way of selling their products.

Some of the examples of the public sector units are Indian Oil Corporation, Bharath Sanchar Nigam Ltd, Bharath Heavy Electricals, Indian Railways, State Road Transport Corporations, Air India etc.

c) Loans and Advances :
When the revenue received by the government from taxes and from non-tax sources is not sufficient to meet the needs of government expenditure, it may receive loans from the financial institutions operating within the country and also from the public. Modem government can also obtain loans from foreign government and international financial institutions.

d) Grants-in-Aid :
Grants are amounts received without any condition of repayment. They are not repaid. State governments receive such grants from the central government. The central government may receive such grants from foreign governments or any international funding agency.

Grants are of two types.
1. General Grants :
When a grant is given to meet shortage of funds in general without specifying a purpose, it is called general grant.

2. Specific Grants :
When a grant is given for a specific purpose it is called a specific grant. It cannot be spent on any other purpose. Ex : education grant and family planning grant etc.

TS Inter 1st Year Economics Study Material Chapter 8 Theories of Employment and Public Finance

Question 4.
Explain the concept of public debt Describe the various methods of redemption of public debt
Answer:
When the government’s expenditure exceeds its revenue one option it has is to go for public debt. A government can borrow funds from sources within the country or from abroad. This creates public debt.

Types of Public Debt:
On the basis of the sources, public debt is classified into two categories :

i) Internal debt :
Internal debt is the debt raised from the sources such as banks, financial institutions and private individuals within the country.

ii) External debt :
The borrowings of the government from the sources outside the country are called external debt. A government can raise external debt from the governments of other countries, international financial institutions like World Bank and International Monetary Fund (IMF) and other funding agencies.

Redemption of public debt means repayment of public debt. All government debts should be rapid promptly. There are various methods of repayment which may be discussed under the following heads.

1) Surplus budget :
Surplus budget means having public revenue in excess of public expenditure. If the government plans for a surplus budget, the excess revenue may be utilized to repay public debt.

2) Refunding :
Refunding implies the issue of fresh bands and securities by government so that the matured loans can be used for repayment of public debt.

3) Annuities :
By this method, the government repays past of the public debt every year. Such annual payments are made regularly till the debt is completely cleared.

4) Sinking fund :
By this method, the government creates a separate fund called Sinking fund’ for the purpose of repaying public debt. This is considered as the best method of redemption.

5) Conversion :
Conversion means that the existing loans are changed into new loans before the date of their maturity.

6) Additional taxation :
Government may resort to additional taxation so as to raise necessary funds to repay public debt under this method new taxes are imposed.

7) Capital levy :
Capital levy is a heavy one time tax on the capital assets and estates.

8) Surplus Balance of payments :
This is useful to repay external debt for which foreign exchange is required surplus balance of payment implies exports in excess of imports by which reserves of foreign exchange can be created.

Question 5.
Analyse the central, state financial relations in India.
Answer:
The financial relationship between the centre (union) and the states is provided in the constitution. The constitution gives a detailed scheme of distribution of financial resources between union and the states. The constitution makes a broad distinction between the power to levy a tax and the power to appropriate the proceeds of a tax. Thus the legislature which levies a tax is not necessarily the authority which retains the proceeds of a tax levied.

The constitution grants the union parliament exclusive power to levy taxes on several items. The state legislatures enjoy similar power with regard to several other specified items. In general, the union parliament levies taxes on items mentioned in the union list while the state legislatures levy taxes on items mentioned in the state list.

1) Exclusive Powers of Union Government:
The subjects on whom the union government has the exclusive powers to levy taxes are :
a) Customs duty, b) Corporation tax, c) Capital gains, c) Surcharge on income tax and c) Railway fares etc.

2) Exclusive Powers of State Governments :
State’s exclusive powers to tax include : a) Land revenue, b) Stamp duty, c) Estate duty, d) Entry tax, e) Sales tax and f) Taxes on vehicles and Luxuries etc.

The residuary power of taxation belongs to the centre. It means that the subjects which have not been included either in the union or in the state list may be taxed only by the union government. In the matter of taxation, the constitution recognizes no concurrent jurisdiction. Hence there is no subject who may be taxed both by the union and the state governments.

Besides the exclusive power of taxation of the union and the state governments, there are 3 other categories of taxes. They are :
a) Taxes levied by the union government but collected and appropriated by the states. Stamp duties on bills of exchange, excise duties on medicinal and toilet preparations fall in this category.

b) Certain duties are levied and collected by the union but the net proceeds of such taxes are distributed among the states. Each state gets that amount of the tax as is collected with in its territory. Succession duty, estate duty on property other than agricultural land, taxes on railway fares and freights, taxes on news paper sales and advertisements etc., fall in this category.

c) Certain taxes are levied and collected by the union but the proceeds are distributed between the centre and the states. Taxes on non-agricultural income (Art. 270) and excise duties on items in the union list except medicinal and toilet preparations fall in this category.

3) Miscellaneous Powers:
i) After 73rd and 74th Amendment of the Constitution, a provision is made for the constitution of the consolidated fund of state from which resources are to be provided to the village panchayats and municipalities.

ii) According to Article 360, during the proclamation of financial emergency, the President can give financial directives to the states. The union government supplements the financial resources of the states by two other means besides distribution of tax revenues. There are : a) Advancement of central loans and b) Grants-in-aid given to the states.

TS Inter 1st Year Economics Study Material Chapter 8 Theories of Employment and Public Finance

Question 6.
Write an essay on Federal Finance.
Answer:
Federal finance means the finance of the central government as well as the state governments and the relationship between the two. In a federal system of finance, all items of revenue and expenditure are divided among the central, state and local governments. All the three forms of government are free to make expenditure on their respective heads and to get revenue from their respective sources.

Characteristics of a Federal Finance :
The following are some of the important characteristic features of federal finance :

  1. In the federal finance, the sources of income and heads of expenditure are distributed between the central and state governments according to the constitution. Their jurisdiction and rights are clearly defined in the constitution.
  2. In the federal system the central government provides financial aid to states.
  3. Although the state government have administered autonomy, yet they remain subordinate to the centre. No state is free to fall apart from central government on its own.
  4. In case of any financial dispute arising between the central and the state governments, the solution there of is sought according to the constitutional provisions. India with a federal form of government has a federal finance system.

The essence of the federal form of government is that the central and state governments should be independent of each other in their respective spheres of action. The constitution should spell distinctly and separately the functions to be performed by respective governments. Once the functions of the governments have been spelt out, it becomes equally important that each of the governments should be provided with competent sources of raising adequate revenue to discharge the functions entrusted to it. Thus, for the successful operation of the federal form of government, two important conditions are essential, viz.

  1. Each government should have independent sources of revenue, and
  2. Each government should have total command over its resources to meet its needs.

In short, financial independence and adequacy constitute the backbone of the federal
finance system.

Question 7.
Describe the concept, components and types of budget.
Answer:
Budget is an annual statement showing the estimated receipts (revenue) and expenditure of a government for a financial year (April – March). The governments present to the legislature an annual budget every year for its approval. The budget is presented by the finance minister. The government cannot incur any expenditure unless it has the prior approval of the legislature.

Sometimes a vote on account budget is presented by the government when it is not possible to present the full budget. It is an interim budget for a few months. This will facilitate the government to incur expenditure pending approval of the regular budget.

Objectives :
The main purpose of the budget is to obtain approval of the legislature for the tax proposals and allocation of resources to various government activities. The government utilizes the occasion to state its policies and programmes.

Budget Estimates :
In the budget, budget estimates for the ensuing financial year are shown along with the actual expenditure of the preceding financial year, and budget estimates and revised estimates for the current financial year. For a clear understanding of these estimates, budget at a glance for the year 2013-14.

Components of the Budget :
The budget consists of both receipts (income) and expenditure of the government. The budget of the Government of India consists of two main components :
1) Budget Receipts:
a) Revenue Receipts :
This consists of tax revenue and non-tax revenue and

b) Capital Receipts :
This consists of recoveries of loans, other receipts and borrowings and other liabilities.

2) Budget Expenditure :
In the Union budget of India, the budget expenditure is classified into plan expenditure and non-plan expenditure. Each category is further divided into revenue account and capital account. Let us enlist them as hereunder :
i) Plan Expenditure:
a) Plan expenditure on revenue account.
b) Plan expenditure on capital account.

ii) Non-plan Expenditure :
a) Non-Plan expenditure on revenue account.
b) Non-Plan expenditure on capital account.

Again the plan expenditure and the non-plan expenditure is summed up and shown as revenue expenditure and capital expenditure.

Types of Budget:
There are three types of budgets based on the difference between the receipts and expenditure:
1) Surplus Budget :
This refers to the budget in which the total revenue is more than the total expenditure (R>E).

2) Deficit Budget :
This refers to the budget in which the total expenditure exceeds the total revenue (R<E).

3) Balanced Budget :
This refers to the budget in which the total expenditure and the total revenue are equal (R = E).

Short Answer Questions

Question 1.
“Supply creates its own demand”. Explain the statement ofJ.B. Say.
Answer:
Classical theory of employment or the theory of output and employment developed by economists such as Adam Smith, David Ricardo, Robert Malthus etc., it is based on the J.B Say’s law of market’. According to this law “supply creates its own demand”. The classical theory of employment assumes that there is always full employment of labour and other resources.

According to this law the supply always equals to demand it can be expressed as S=D. Whenever additional output is produced in the economy. The factors of production which participate in the process of production. Earn income in the form of rent, wages, interest and profits.

The total income so generated is equivalent to the total value of the additional output produced. Such income creates additionl demand necessary for the sale of the additional output. Therefore the question of addition output not being sold does not arise.

TS Inter 1st Year Economics Study Material Chapter 8 Theories of Employment and Public Finance

Question 2.
Enumerate the assumptions and major aspects of classical theory of employment
Answer:
The classical theory of employment is based on the Say’s law of markets. The famous law of markets, propounded by the J.B Say states that “Supply creates its own demand”.

Assumptions :
The Say’s law is based on the following assumptions.

  1. There is a free enterprise economy.
  2. There is perfect competition in the economy.
  3. There is no government interference in the functioning of the economy.
  4. The equilibrium process is considered from the long term point of view.
  5. All savings are automatically invested.
  6. The interest rate is flexible.
  7. The wage rate is flexible.
  8. There are no limits to the expansion of the market.
  9. Money acts as medium of exchange.

Aspects of Classical Theory :
The classical theory of employment can be discussed with three dimensions.

A) Goods Market Equilibrium :
The classical theory of employmet is based on the Say’s Law of Markets. The first part of Say’s market law explains the goods market equilibrium. The famous law of markets, propounded by the J.B. Say states that, “Supply creates its own demand”.

B) Money Market Equilibrium (Saving Investment Equilibrium) :
The goods market equilibrium leads to bring equilibrium of both money and labour markets. In goods market, it is assumed that the total income is spent. The classical economists agree that part of the income may be saved, but the savings is gradually spent on capital goods. The expenditure on capital goods is called investment. It is assumed that equality between savings and investment (S=I) is brought by the flexible rate of interest.

C) Labour Market Equilibrium :
Pigou’s Wage Cut Policy: According to the classical economists, unemployment may occur in the short run. This is not because the demand is not sufficient but due to increase in the wages forced by the trade unions or the interference of government. A.C. Pigou suggested that reduction in the wages will remove unemployment. This is called wage – cut policy. A reduction in the wage rate results in the increase in employment.

Question 3.
Distinguish between aggregate supply price and aggregate demand price.
Answer:
Aggregate supply price: When an entrepreneur gives employment to certain amount of labour. It requires the use of other factors of production or inputs. All these inputs have to be paid remunerations. When all these are added what we get is the value of the output produced or the expenditure incurred to supply employment for a specific number of labourers. By selling the output the entrepreneurs must expect to receive atleast what they have spent. This is known as the “Aggregate supply price” of the output or level of employment. As the level of output increases with the level of employment, aggregate supply price also increases with every increase in the level of employment.

Aggregate demand price :
In Keynes theory the aggregate demand determines the level of employment. The aggregate demand price for a given output is the amount of money which the firms expect to receive from the sale of that output. Then aggregate demand will be equal to the sum of consumption (C) investment (I) and Government expenditure (G) for goods and services.
Therefore, Aggregate demand (AD) = C+ I + G.

As the level of employment rises, the total income of the community also rises and therefore the aggregate demand, price also increases.

Question 4.
Explain the criticism against the classical theory of employment
Answer:
The classical theory of employment came in for severe criticism from J.M. Keynes. The main points of criticism are as follows :

  1. The assumption of full employment is unrealistic. It is rare phenomenon and not a normal features.
  2. The wage cut policy is not a practical policy in modem times. The supply of labour is a function of money wage and not real wage. Trade unions would never accept any reduction in the money wage rate.
  3. Equilibrium between savings and investment is not brought about by a flexible rate of interest. Infact, saving is a function of income and not interest.
  4. The process of equilibrium between supply and demand is not realistic. Keynes commented the self adjusting mechanism doesn’t always operate.
  5. Long run approach to the problem of unemployment is also not realistic. Keynes commented, “we are all dead in the long ran”. He considered unemployment as a short-run problem and offered immediate solution through his employment theory.
  6. It is not correct to say that money is neutral. Money acts not only as a medium of exchange but also as a store of value. Money influences variables like consumption, investment and output.

TS Inter 1st Year Economics Study Material Chapter 8 Theories of Employment and Public Finance

Question 5.
Explain the concept of effective demand.
Answer:
Effective demand means where aggregate demand equals the aggregate supply. When aggregate demand is equal to aggregate supply the economy is in equilibrium. This can be shown in the table.

Level of employmentAggregate supply priceAggregate demand price
10500600
11550625
12600650
13650675
14700700 AD = AS
15750725
16800750

In the table when the level of employment is 14 lakh workers, aggregate demand price is equal to aggregate supply price i.e., 1700 crores. This can be shown in the following diagram.

In the above diagram aggregate demand price curve (AD) and the aggregate supply price curve (AS) interest each other at point Er It shows the equilibrium point. The equilibrium has been attained at ON1 level of employment. It is assumed that ON1 in the above diagram does not indicate full employment as the economy is having idle factors of production. So it is considered as under-employment equilibrium.
TS Inter 1st Year Economics Study Material Chapter 8 Theories of Employment and Public Finance 5

According to Keynes, to achieve full employment an upward shift of aggregate demand curve is required. This can be possible through government expenditure on goods and services supplied in the economy, whenever private entrepreneurs may not show interest to invest. With this the AD1 curve (C + I) shift as AD2 (C + I + G) at new point of effective demand E2, where the economy reaches full employment level i.e., ONF.

Question 6.
What are the sources of public revenue? [Mar. ’16]
Answer:
Revenue received by the government from different sources is called public revenue. Public revenue is classified into two kinds.

  1. Tax revenue
  2. Non-Tax revenue.

1) Tax Revenue :
Revenue received through collection of taxes from the public is called tax revenue. Both the state and central government collect taxes as per their allocation in the constitution.

Taxes are two types.
a) Direct taxes:

  1. Taxes on income and expenditure. Ex : Income tax, Corporate tax etc.
  2. Taxes on property and capital assests. Ex: Wealth tax, Gift tax etc.

b) Indirect taxes :
Taxes levied on goods and services. Ex: Excise duty, Service tax.

2) Non – tax revenue :
Government receives revenue from sources other than taxes and such revenue is called non-tax revenue. They are :
a) Administrative revenue :
Government receives money for certain administrative services. Ex : License fee, Tuition fee etc.

b) Commercial revenue :
Modern governments establish public sector units to manufacture certain goods and offer certain services. The goods and services are exchanged for the price. So such units earn revenue by way of selling their products. Ex: Indian Oil Corporation, Bharath Sanchar Nigam Ltd, Bharath Heavy Electricals, Indian Railways, State Road Transport Corporations, Indian Air lines etc.

c) Loans and advances :
When the revenue received by the government from taxes and from the above non-tax sources is not sufficient to meet the needs of government expenditure, it may receive loans from the financial institutions operating within the country and also from the public. Modem government also taken loans from international financial institutions.

d) Grants-in-aid :
Grants are amount received without any condition of repayment. They are not repaid.
These are two types. 1. General grant, 2. Specific grant.

Question 7.
List out various items of public expenditure.
Answer:
Public expenditure is an important constituent of public finance. Modem governments spend money from various welfare activities. The expenditure incurred by the government on various economic activities is called public expenditure.

Governments incur expenditure on the following heads of accounts.

  1. Defence
  2. Internal security
  3. Economic services
  4. Social services
  5. Other general services
  6. Pensions
  7. Subsidies
  8. Grants to state governments
  9. Grants to foreign governments
  10. Loans to state governments
  11. Loans to public enterprises
  12. Loans to foreign governments
  13. Repayment of loans
  14. Assistance to states on natural calamities etc.

TS Inter 1st Year Economics Study Material Chapter 8 Theories of Employment and Public Finance

Question 8.
Point out the redemption methods of public debt. [Mar,’17]
Answer:
Repayment of debt by government is called redemption of public debt. Internal debt can be repaid in the domestic currency but foreign exchange is necessary to repay external debt.

Redemption of Public Debt:

The following are the methods of redemption of public debt.
1) Surplus Budgets :
Surplus budget means having public revenue in excess of public expenditure. If the government plans for a surplus budget, the excess revenue may be utilized to repay public debt.

2) Refunding :
Refunding implies the issue of fresh bonds and securities by the government so that the matured loans can be used for repayment of public debt.

3) Annuities :
By this method the government repays part of the public debt every year. Such annual payments are made regularly till the debt is completely cleared.

4) Sinking Fund :
By this method, the government creates a separate fund called ‘Sinking fund’ for the purpose of repaying public debt. A part of the public revenue is deposited into this fund every year so that public debt is repaid from the sinking fund. This is considered as the best method of redemption.

5) Conversion :
Conversion means that the existing loans are changed into new loans before the date of their maturity. This method is advantageous when the rate of interest charged on the new loans is less than the rate of interest to be paid on the existing loans.

Question 9.
What are the characteristics of federal finance? [Mar. ’17]
Answer:
Federal finance means the finance of the central government as well as the state governments and the relationship between the two. In a federal system of finance, all items of revenue and expenditure are divided among the central, state and local governments. All the three forms of government are free make expenditure on their respective heads and to get revenue from their respective sources.

Characteristics of a Federal Finance :
The following are some of the important characteristic features of federal finance :

  1. In the federal finance, the sources of income and heads of expenditure are distributed between the central and state government according to the constitution. Their jurisdiction and rights are clearly defined in the constitution.
  2. In the federal system the central government provides financial aid to states.
  3. Although the state government have administered autonomy, yet they remain subordinate to the centre. No state is free to fall apart from central government on its own.
  4. In case of any financial dispute arising between the central and the state governments, the solution thereof is sought according to the constitutional provisions. India with a federal form of government has a federal finance system.

Question 10.
Write a note on Finance Commission and its functions. [Mar. ’16]
Answer:
The Finance Commission of India came into existence in 1951. It was established under Article 280 of the Indian Constitution by the President of India. It was formed to define the financial relations between the centre and the state. As per the Constitution, the commission is appointed for every five years and consists of a chairman, secretary and four other members. The first finance commission submitted its report in 1952.

The finance commission advises the President, what percentage of the income tax should be retained by the centre, and what principles should be adopted to distribute the divisible pool of the income tax among the states. Since the institution of the first finance commission, stark changes have occurred in the Indian economy causing changes in the macro economic scenario. This has led to major changes in the finance commission’s recommendations over the years. Till date, fourteen finance commissions have submitted their reports.

Functions of Finance Commission :
The functions of the finance commission can be explicitly stated as :

  1. Distribution of net proceeds of taxes between centre and the states, to be divided as per their respective contributions to the taxes.
  2. Determine factors governing grants-in aid to the states and the magnitude of the same.
  3. To make recommendations to President as to the measures needed to augment the consolidated fund of a state to supplement the resources of the panchayats and municipalities in the state on the basis of the recommendations made by the finance commission.

TS Inter 1st Year Economics Study Material Chapter 8 Theories of Employment and Public Finance

Question 11.
Explain the budget deficits.
Answer:
Generally speaking, budget deficit arises when the total expenditure in the budget exceeds the total receipts (income). Technically there are four types of deficits with reference to a budget:
1) Revenue Deficit :
Revenue deficit arises when revenue expenditure exceeds revenue receipts.
Revenue deficit = revenue receipts – revenue expenditure.

2) Budget Deficit :
Budget deficit is the difference between the total receipts and the total expenditure.
Budget deficit = Total receipts – Total expenditure.

3) Fiscal Deficit :
Fiscal deficit is the difference between the total expenditure and the total revenue plus the market borrowings.
Fiscal deficit = (Total revenue – Total expenditure) + Market borrowings & Other liabilities.
(or)
Fiscal deficit = Budget deficit + Market borrowings and Other liabilities.

4) Primary Deficit :
Primary deficit is the fiscal deficit minus interest payments.
Primary deficit = Fiscal deficit – Interest payments.

Modem governments have been resorting to deficit budgets in order to meet the growing expenditure needs to finance for economic development. But it is not desirable to have large deficits, particularly fiscal deficit as it would have adverse effects on the economy.

Very Short Answer Questions

Question 1.
How do you explain the term classical economics?
Answer:
The term classical economics refers to the body of economic group which held their influence from the letter half of the 18th century to the early part of the 20th century. The most important principle of classicism are personal liberty. Private property and freedom of private enterprise.

Question 2.
What is Money Market Equilibrium?
Answer:
Money Market Equilibrium (Savings Investment Equilibrium) :
The goods market equilibrium leads to bring equilibrium in both money and labour markets. In the goods market, it is assumed that the total income is spent. The classical economists agree that part of the income may be saved, but the savings are gradually spent on capital goods. The expenditure on capital goods is called investment. It is assumed equality between savings and investment (S=I) is brought by the flexible rate of interest. This is explained in the Fig.
TS Inter 1st Year Economics Study Material Chapter 8 Theories of Employment and Public Finance 6

In diagram, savings and investment are measured on the OX axis and rate of interest is shown on the OY axis. Savings and investments are equal at Oi rate of interest where the curves intersect each other. Hence, Oi is the equilibrium rate of interest which will come to stay in the market. If any change in the demand for investment and supply of savings comes about, the curves will shift accordingly, and the equilibrium rate of interest will also change and further it brings savings and investment into equality. Thus, money market equilibrium can be automatically brought through the rate of interest flexibility.

TS Inter 1st Year Economics Study Material Chapter 8 Theories of Employment and Public Finance

Question 3.
What is Say’s law of markets?
Answer:
J.B Say a French economist advocated the famous ‘Law of markets’ on which the classical theory of employment is based. According to this law “supply creates its own demand”. According to this law whenever additional output is created. The factors of production which participate in that production receive incomes equal to that value of that output. This income would be spent either on consumption goods or on capital goods. Thus additional demand is created matching the additional supply.

Question 4.
Explain the functioning of market mechanism in the economy.
Answer:
Market mechanism is often interpreted as a ‘free’ market system. Productive efficiency, while allocate efficiency is only a feature of perfect competition. A mechanism is a mathematical structure that models institutions through which economic activity is guided and coordinated. They seek to do so in ways that economize on the resources needed to operate the institutions, and that provide incentives that induce the required behaviors.

  1. No governmental intervention.
  2. Consumer’s sovereignty : In market economy, consumers are sovereign.
  3. Personal freedom and motives.
  4. Personal property.
  5. Perfect competition.

Question 5.
What do you mean by full employment?
Answer:
Full employment is a situation in which all those who are willing to work at the existing wage rate are engaged in work.

Question 6.
What is an Aggregate Demand Function?
Answer:
The schedule showing aggregate demand prices at different levels of employment in the economy is called as aggregate demand function.

Question 7.
What is the relationship between level of employment and Aggregate supply price?
Answer:
The schedule showing the aggregate supply price at different levels of employment is called the aggregate supply price.

Question 8.
What is Effective Demand?
Answer:
Effective demand is that aggregate demand which becomes equal to the aggregate supply. This refers to the aggregate demand at equilibrium.

TS Inter 1st Year Economics Study Material Chapter 8 Theories of Employment and Public Finance

Question 9.
What do you mean by Wage – cut policy? [Mar. ’17]
Answer:
Wage cut policy is one of the assumption of classical theory of employment which was started by “AC Pigou” who defended the classical theory and its full employment assumption. To Pigou and others the wage fund is given. The wage rate determined by dividing the wage fund with the number of workers. Pigou advocated a general cut in money wages in times of depression to restore full employment.

If there is a problem of unemployment in the economy. It is possible to solve this problem by reducing the money wages of the workers. This is known as “wage cut policy”.

Question 10.
Define public finance.
Answer:
It deals with the income and expenditure of the public authorities. (Central state and local government.

Question 11.
Differentiate tax revenue and non – tax revenue.
Answer:
Tax Revenues: Revenue received through collection of taxes from the public is called tax revenue. Both the central and state governments collect taxes as per their allocation in the constitution.
Broadly taxes are divided into two categories : (a) direct taxes, (b) indirect taxes.

2. Non – Tax revenue :
Government also receives revenue from sources other than taxes and such revenue is called the non – tax revenue. The sources of non – tax revenues are as follows :
a) Administrative Revenue
b) Commercial Revenue
c) Loan and advances
d) Grants – in – AID.

Question 12.
What is meant by Public expenditure?
Answer:
Public expenditure is an important constituent of public finance. Modem governments spend money perform various financiers. The expenditure incurred by the government on various economic activities is called public expenditure. For example, defence, internal security and economic services.

Question 13.
What is Public Debt?
Answer:
Public Debt :
When the government’s expanding expenditure on various activities exceeds its revenue it has one option i.e., is to go for public debt. A government can borrow funds rom various sources within the country or from abroad. This creates public debt. The instruments of public debt are in the form of various types of government bonds and securities.

Question 14.
What are the Debt Redemption methods.
Answer:
Redemption of Public Debt:
The following are the methods implemented for the redemption of public debt:

  1. Surplus Budgets
  2. Refunding
  3. Annuities
  4. Sinking Fund
  5. Conversion
  6. Additional taxation,
  7. Capital Levey
  8. Surplus in Balance of Trade.

TS Inter 1st Year Economics Study Material Chapter 8 Theories of Employment and Public Finance

Question 15.
What is capital levy?
Answer:
Capital Levy is a heavy one time tax on the capital assets and estates over and above a minimum limit of value. This means acquiring funds for debt redemption all at a time.

Question 16.
What is Federal Finance?
Answer:
Federal finance means the finance of all central government as well as the state governments and the relationship between the two. In a federal system of finance, all items of revenue and expenditure are divided among the central, state and local governments. All the three forms of government are free to make expenditure on their respective heads and to get revenue from their respective sources.

Question 17.
Mention the functions of Finance commission.
Answer:
The functions of the finance commission can be explicitly stated as :

  1. Distribution of net proceeds of taxes between centre and the states, to be divided as per their respective contributions to the taxes.
  2. Determine factors governing grants in aid to the states and the magnitude of the same.
  3. To make recommendations to President as to the measures needed to augment the consolidated fund of a state to supplement the resources of the panchayats and municipalities in the state on the basis of the recommendations made by the finance commission.

Question 18.
What is budget?
Answer:
Budget is the annual statement showing the estimated receipts and expenditure of the government for a financial year in the budget. The budget estimates and revised estimates of the current financial year and actual expenditure of the preceding financial year are shown. .

Question 19.
What are the components of a budget?
Answer:
Components of the Budget :
The budget consists of both receipts (income) and expenditure of the government. The budget of the Government of India consists of two main components :
1. Budget Receipts :
a) Revenue Receipts :
This consists of tax revenue and non – tax revenue and

b) Capital Receipts :
This consists of recoveries of loans, other receipts and borrowings and other liabilities.

2. Budget Expenditure :
In the Union budget of India, the budget expenditure is classified into plan expenditure and non – plan expenditure. But, Central Government through its Union Budget 2017 – 18 abondoned plan and non – plan expenditure and replaced these items with Revenue Expenditure and Capital Expenditure.

Persual of the budget at a glance gives a vivid pitcture of the structure of the budget and its components as followed by the government of India in actual practice.

TS Inter 1st Year Economics Study Material Chapter 8 Theories of Employment and Public Finance

Question 20.
Distinguish between revenue account and capital account.
Answer:
Revenue account consists of the current transactions and includes value of transactions relating to export import travel expenses, insurance, investment, income etc. The capital account refers to the transactions of capital nature such as borrowing and lending of capital repayment of capital sale and purchase of shares and securities etc.

Question 21.
What is meant by Primary deficit?
Answer:
Primary deficit is the fiscal deficit minus the interest payments.

Question 22.
In deficit Budget desirable?
Answer:
Budget deficit is the difference between the total receipts and total expenditure.

Question 23.
What are the exclusive powers of union Government?
Answer:
Exclusive Powers of Union Government:
The subjects on whom the union government has the exclusive powers to levy taxes are : (a) customs duty, (b) corporation tax, (c) capital gains, (d) surcharge on income tax and (e) railway fares etc.

Question 24.
What is Fiscal deficit?
Answer:
Fiscal deficit is the difference between total revenue and total expenditure plus the market borrowings.

Fiscal deficit = (Total revenue – total expenditure) + Other borrowing and other liabilities.

Question 25.
What is the significance of vote on account budget?
Answer:
Vote on account is an interim budget presented for a few months pending presentation at the regular budget.

Question 26.
Write about Fourteenth Finance Commission.
Answer:
Fourteenth Finance Commission :
The First Finance Commission submitted its report in 1952. The Finance Commission advises the President about what percentage of the income tax should be retained by the centre, and what principles should be adopted to distribute the divisible pool of the income tax among the states. Since the institution of the First Finance Commission, stark changes have occurred in the Indian economy causing changes in the macroeconomic scenario. This has led to major changes in the Finance Commission’s recommendations over the years.

Hence, it has become necessary to have a glance at the Fourteenth Finance Commission’s (2015-2020) recommendations. The Committee specifically suggested the suitable measures so as to maintain a stable and sustainable fiscal environment in the country. The 14th Finance Commission was appointed on 2nd January 2013 under the Chairmanship of Y.VReddy, it has submitted its report 15th December 2014.

Question 27.
Write about Fifteenth Finance Commission.
Answer:
Fifteenth Finance Commission :
The Government of India appointed the Fifteenth Finance Commission on November 27, 2017 with N.K. Singh as Chairman. The recommendations of the Commission will cover the five year period 2020 – 25. The Commission has been asked to submit its report by October 30, 2019.

The Commission has been instructed to use the population data of 2011 census as the base for calculating the expenditure needs of various states. This is the first Commission which is required to present its recommandations in the post GST era.

TS Inter 1st Year Economics Study Material Chapter 8 Theories of Employment and Public Finance

Question 28.
Write in brief, about GST.
Answer:
GST :
Goods and Services Tax (GST) is an Indirect Tax which has replaced many Indirect Taxes in India. The Goods and Service Tax Act was passed in the Parliament on 29th March 2017. the Act came into effect on 1st July 2017; GST is a comprehensive, multistage, destination-based tax that is levied on every value addition. In simple words, GST is an indirect tax levied on the supply of goods and services. Under this system four slabs are fixed for GST rates i.e., 5%, 12%, 18% and 28%.

TS Inter 1st Year Economics Study Material Chapter 3 Demand Analysis

Telangana TSBIE TS Inter 1st Year Economics Study Material 3rd Lesson Demand Analysis Textbook Questions and Answers.

TS Inter 1st Year Economics Study Material 3rd Lesson Demand Analysis

Long Answer Questions

Question 1.
What is a Demand Function? What are the factors that determine the demand for a good?
Answer:
The functional relationship between the demand for a commodity and its various determinants may be explained mathematically in terms of a demand function.
Dx = f(Px, P1 Pn, Y, T)
Where, Dx = Demand for good X;
Px = price of X;
P1 …. Pn = Prices of substitutes and complementaries
Y Income,
T = Taste of the consumer.

Determinants of demand:
1) Price of commodity :
The demand for any good depends on its price, more will be demanded at lower price and vice-versa.

2) Prices of substitutes and complementaries :
Demand is influenced by changes in price of related goods either substitutes or complementary goods.
Ex : Increase in the price of coffee leads an increase in the demand for tea in the case of substitutes positive relation and complementaries negative relationship between price and demand.

3) Income of the consumer :
Demand always changes with a change in the incomes of the people. When income increases the demand for several commodities increases and vice-versa.

4) Population :
A change in the size and composition of population will effect the demand for certain goods like food grains, clothes etc.

5) Taste and preferences :
A change in the taste and the fashions bring about a change in the demand for a commodity.

6) Technological changes :
Due to economic progress technological changes the quantity the quality of goods available to the consumers increase.
Ex : Demand for cell phones reduced the demand for landline phones.

7) Change in the weather :
Demand for commodity may change due to a change in climatic condition.
Ex : During summer demand for cool drinks, in winter demand for woollen clothes.

8) State of business :
During the period of prosperity, demand for commodities will expand and during depression demand will contract.

TS Inter 1st Year Economics Study Material Chapter 3 Demand Analysis

Question 2.
Explain the law of demand and examine its exceptions.
Answer:
Demand means a desire which is backed up by ability to buy and willingness to pay the price is called Demand in Economics. Thus demand will be always to a price and time. Demand has the following features.

  1. Desire for the commodity.
  2. Ability to buy the commodity.
  3. Willing to pay the price of commodity.
  4. Demand is always at a price.
  5. Demand is per unit of time i.e., per day, week etc.

Therefore, the price demand may be expressed in the form of small equation.
Dx = f(Px)

Price demand explains the relation between price and quantity demanded of a commodity. Price demand states that there is an inverse relationship between price and demand.

Law of demand :
Marshall defines the law of demand as, “The amount demanded increases with a fall in price and diminishes with a rise in price when other things remain the same”. So, the law of demand explains the inverse relationship between the price and quantity demanded of a commodity.

Demand schedule :
It means a list of the quantities demanded at various prices in a given period of time in a market. An imaginary example given below.

Price in ₹Quantity Demanded units
510
420
330
240
150

The table shows that as the price falls to ₹ 1/- the quantity demanded 50 units, when price ₹ 5/- he is buying 10 units. So, there is inverse relationship between price and demand. Price is low demand will be high and price is high demand will be low. We can illustrate the above schedule in a diagram.
TS Inter 1st Year Economics Study Material Chapter 3 Demand Analysis 1

In the above diagram on X-axis demand is shown and price is on Y-axis. DD is the demand curve. Demand curve slopes downwards from left to right.

Assumptions :

  1. No change in the income of consumer.
  2. The taste and preferences consumers remain same.
  3. The prices of related goods remain the same.
  4. New substitutes are not discovered.
  5. No expectation of future price changes.

Exceptions :
In certain situations, more will be demanded at higher price and less will be demanded at a lower price. In such cases the demand curve slopes upward from left to right which is called an exceptional demand curve.

This can be shown in the following diagram.
TS Inter 1st Year Economics Study Material Chapter 3 Demand Analysis 2

In the diagram when price increases from OP to OP1, demand also increases from OQ to OQ1 This is opposite to law of demand.

1) Giffen’s Paradox :
This was stated by Sir Robert Giffen. He observed that poor people will demand more of inferior goods, if their prices rise. Inferior goods are known as Giffen goods.
Ex : Ragee, Jowar etc. He pointed out that in case of the English workers, the law of demand does not apply to bread. Giffen noticed that workers spend a major portion of their income on bread and only small portion on meat.

2) Veblen Effect (Prestigious goods) :
This exception was stated by Veblen. Costly goods like diamonds and precious stones are called prestige goods or veblen goods. Generally, rich people purchase those goods for the sake of prestige. Hence, rich people may buy more such goods when their prices rise.

3) Speculation :
When the price of a commodity rises the group of speculators expect that it will rise still further. Therefore, they buy more of that commodity. If they expect that there is a fall in price, the demand may not expand.
Ex : Shares in the stock market.

4) Illusion :
Sometimes, consumer develop to false idea that a high priced good will have a better quality instead of low priced good. If the price of such good falls, demand decreases, which is contrary to the law of demand.

TS Inter 1st Year Economics Study Material Chapter 3 Demand Analysis

Question 3.
Explain the concepts of income and cross demands with suitable diagrams.
Answer:
The concept of demand has great significance in economics. In general language, demand means a desire but in economics the desire backed up by ability to buy and willingness to pay the price.

Types of demands :
The demand may be classified into 3 types.

  1. Price demand.
  2. Income demand.
  3. Cross demand.

1) Price demand :
Price demand explains the relationship between price and quantity demanded of a commodity it shows the inverse relationship between price and demand when the other things like consumer’s income, taste etc., remains constant. It means the price falls demand extends and price rises demand contracts. The price demand can be expressed Dx = f(Px)

Price demand can be explained with the help of demand schedule.

PriceQuantity Demanded
510
420
330
240
150

As price falls to ₹ 1/- the quantity demand is 50 units, when price of apple is ₹ 5/- he is buying 10 units. So, the table shows inverse relationship between price and demand.

Price demand can be explained with the help of the demand curve.
TS Inter 1st Year Economics Study Material Chapter 3 Demand Analysis 3

On OX axis shows demand, OY axis shows price. We can obtain the demand curve ‘DD’ by joining all the points A, B, C, D, E which represents various quantities of demand at various prices. ‘DD’ is demand curve. It slopes downwards from left to right. It shows the inverse relationship between price and demand.

2) Income demand :
It explains the relationship between consumer’s income and various quantities of various levels of income assuming other factors like price of goods, related goods, taste etc., remain the same. It means if income increases quantity demand increases and vice-versa. This can be shown in the following form.
Dx = f(Y)

The functional relationship between income and demand may be inverse or direct depending on the nature of the commodity. This can be shown in the following table.

IncomeDemand
Superior goodInferior good
2,000412
4,000610
6,00088
8,000106
10,000124

Superior goods :
In case of superior goods quantity demanded will increase when there is an increase in the income of consumers.
TS Inter 1st Year Economics Study Material Chapter 3 Demand Analysis 4

In the diagram ‘X’ axis represents demand, OY axis represents income, YD represents the income demand curve. It showing positive slope whenever income increased from OY to OY1; the demand of superior or normal goods increases from OQ to OQ1.

This may happen in case of Veblen goods.

Inferior goods :
On the contrary quantity demanded of inferior goods decreases with the increase in incomes of consumers.
TS Inter 1st Year Economics Study Material Chapter 3 Demand Analysis 5

In the diagram on ‘OX’ axis measures demand and OY axis represents income of the consumer. When the consumer income increases from OY to OY1 the demand for a commodity decreases from OQ to OQ1 So the YD’ curve is negative sloping.

3) Cross demand :
Cross demand refers to the relationship between any two goods which are either complementary to each other or substitute for each other. It explains the functional relationship between the price of one commodity and quantity demanded of another commodity is called cross demand.
TS Inter 1st Year Economics Study Material Chapter 3 Demand Analysis 6
Dx = f(Py)
Where, Dx = demand for ‘X’ commodity
Py = Price of ‘Y’ commodity
f = function

Substitutes :
The goods which satisfy the same want are called substitutes.
Ex: Tea and coffee; pepsi and coca-cola etc. In the case of substitutes, the demand curve has a positive slope.
TS Inter 1st Year Economics Study Material Chapter 3 Demand Analysis 7

In the diagram ‘OX’ axis represents demand of tea and OY axis represents price of coffee. Increase in the price of coffee from OY to OY2 leads to increase in the demand of tea from OQ to OQ2.

Complementaries :
In case of complementary goods, with the increase in price of one commodity, the quantity demanded of another commodity falls. Ex: Car and Petrol. Hence, the demand curve of these goods slopes downward to the right.

In the diagram, if price of car decreases from OP to OP2 the quantity demand of petrol increases from OQ to OQ2. So cross demand i.e., CD curve is downward sloped.

Question 4.
Define the concept of elasticity demand. Also explain income and cross elasticities of demand.
Answer:
The concept of elasticity demand was first introduced by Cournot and Mill. Later it was developed in a scientific manner by Marshall. Elasticity of demand means the degree of sensitiveness or responsiveness of demand to a change in its price.

According to Marshall, “The elasticity of demand in a market is great or small according as the amount demanded increases much or little for a given fall in price”.

The concept of elasticity of demand explains how much or to what extent a change in any one of the independent variables leads to change in the dependent variable.

There are three kinds of elasticity of demand.

  1. Price elasticity of demand
  2. Income elasticity of demand
  3. Cross elasticity of demand

1) Price Elasticity of Demand :
Alfred Marshall developed the concept of price elasticity of demand. Price elasticity of demand is generally defined as the degree of respon siveness or sensitiveness of demand for a commodity to the changes in its price. Thus, price elasticity of demand is the ratio of percentage change in quantity demanded of a good and percentage change in its price. The following formula to measure price elasticity of demand
TS Inter 1st Year Economics Study Material Chapter 3 Demand Analysis 8

where, q= quantity; p = price; ∆q = change in quantity demanded;
∆p = change in price.

There are five kinds of price elasticity of demand. They are :

  1. Perfectly Elastic demand (Ed = ∝)
  2. Perfectly Inelastic demand (Ed = 0)
  3. Unitary Elastic demand (Ed = 1)
  4. Relatively Elastic demand (Ed > 1)
  5. Relatively Inelastic demand (Ed < 1)

2) Income Elasticity of Demand :
Income elasticity of demand shows the degree of responsiveness of quantity demanded of a commodity to a change in the income of the consumer, other things remain constant.
TS Inter 1st Year Economics Study Material Chapter 3 Demand Analysis 9
where, q = Quantity; y = income; ∆Q = change in quantity demanded;
∆y = change in income.

Income elasticity of demand will be positive in case of superior goods like milk and meat and negative in case of inferior goods like porridge and broken rice.

3) Cross Elasticity of Demand :
Cross elasticity of demand refers to change in the quantity demanded of one good in response to change in the price of related good, other things remaining constant. There are certain goods whose demand depend not only on their price but also on the prices of related goods.
TS Inter 1st Year Economics Study Material Chapter 3 Demand Analysis 10
Where, Q(x) = Quantity demanded for X; P(y) = price of commodity (Y), ∆Q(x) = change in quantity demanded of X commodity, ∆P(y) = change in price of commodity Y.

Substitute goods like tea and coffee have positive cross elasticity demand where as complementary goods like shoes and socks have negative cross elasticity of demand.

TS Inter 1st Year Economics Study Material Chapter 3 Demand Analysis

Question 5.
What is price elasticity of demand? Illustrate the various types of price elasticities of demand.
Answer:
Alfred Marshall developed the concept of price elasticity of demand. Price elasticity measures, other things remaining constant, change in the demanded of a good in response to a change in its price. Thus, price elasticity of demand is the ratio of percentage change in quantity demanded of a good and percentage change in its price. Price elasticity can be written as stated below.
TS Inter 1st Year Economics Study Material Chapter 3 Demand Analysis 11
TS Inter 1st Year Economics Study Material Chapter 3 Demand Analysis 12
Where, q = quantity; p = price; ∆q = change in demand; ∆p = change in price

Types of Price Elasticity of Demand : Based on numerical value, price elasticity of demand can be of five types.

  1. Perfectly Elastic demand (Ed = ∞)
  2. Perfectly Inelastic demand (Ed = 0)
  3. Unitary Elastic demand (Ed = 1)
  4. Relatively Elastic demand (Ed > 1)
  5. Relatively Inelastic demand (Ed < 1)

1) Perfectly Elastic demand :
It is also known as “in-finite elastic demand”. A small change in price leads to an infinite change in demand is called perfectly elastic demand. It is horizontal straight line to ‘X’ axis. The numerical value of perfectly elastic demand is infinite (Ed = ∞). It can be shown in the diagram.
TS Inter 1st Year Economics Study Material Chapter 3 Demand Analysis 13
In the diagram, Ed = \(\frac{OQQ_1}{OQ}\) ÷ \(\frac{O}{OP}\)
\(\frac{QQ_1}{OQ}\) × \(\frac{OP}{O}\) = ∞

2) Perfectly Inelastic demand :
It is also known as “zero elastic demand”. In this case even a great rise or fall in price does not lead to any change in quantity demanded is known as perfectly inelastic demand. The demand curve will be vertical to the Y axis. The numerical value is ‘O’. This can be shown in the following diagram.
TS Inter 1st Year Economics Study Material Chapter 3 Demand Analysis 14
In the diagram, Ed = \(\frac{O}{OQ}\) ÷ \(\frac{PP_1}{OP}\) = 0
∴ Ed = 0

3) Unitary Elastic demand :
The percentage change in price leads to same percentage change in demand is called unitary elastic demand. In this case the elasticity of demand is equal to one. The shape of demand curve is “Rectangular Hyperbola”. This can be shown in the following.
TS Inter 1st Year Economics Study Material Chapter 3 Demand Analysis 15
In the diagram, Ed = OP1Q1 = OPQ
(or) OQ1 = PP1
∴ Ed = 1

4) Relatively Elastic demand :
When a percentage change in price leads to more than percentage change in quantity demand is called relatively elastic demand. In this case the numerical value of Ed is greater than one (Ed > 1)
TS Inter 1st Year Economics Study Material Chapter 3 Demand Analysis 16
In the diagram, Ed = OQ1 > PP1
∴ Ed > 1

5) Relatively Inelastic demand :
When the percentage change in price leads to a less than percentage change in quantity demand is called relatively inelastic demand. Here the numerical value is less than one (Ed < 1). This can be shown to following diagram.
TS Inter 1st Year Economics Study Material Chapter 3 Demand Analysis 17
In the diagram, Ed = QQ1 < PP1
∴ Ed < 1

Question 6.
Discuss the factors that determine price elasticity of demand.
Answer:
The term elasticity refers to the measure of extent of relationship between two related variables. The elasticity of demand is the measure of responsiveness or sensitiveness of demand for a commodity to the change in its demand.

Determinants of Elasticity of Demand :
The elasticity of demand varies from commodity to commodity.

1) Nature of Commodity :
Commodities can be grouped as necessaries, comforts and luxuries. In case of necessaries, the elasticity of demand will be inelastic.
Ex : Rice, salt etc. On the other hand in case of luxuries the demand will be more elastic.
Ex : Diamonds and gold etc.

2) Availability of Substitutes :
Prices of substitutes influence the demand for a commodity up to a certain extent. The closer the substitute, the greater the elasticity of demand for the commodity. Ex: Cool drinks, soaps etc., but in case of non-availability of substitutes the elasticity of demand will be low.

3) Complementary Goods :
Price elasticity for a good is also depends on the nature of price elasticity of jointly demand goods. If the demand for car is elastic, then the demand for petrol will also be elastic.

4) Multiple Uses of the Commodity :
The wider the range of alternative uses of a product, the higher the elasticity of demand and vice-versa.
Ex : Coal and electricity have multiple uses and will have elastic demand.

5) Proportion of Income Spent :
If proportion of income spent on commodity is very small, its demand will be less elastic and vice-versa.

6) Period of time :
In the long run, demand will be more elastic. Longer the time period considered, greater will be the possibility of substitution for a cheaper good.
Ex : If the price of petrol increases in the short run, it may not be possible to replace the petrol engines with diesel engines but in the long run it can be possible.

7) Price Level :
Goods which are in very high range or in very low range have inelastic demand but it is high at moderate price.

8) Habit :
The demand for a commodity to which the consumer is accustomed is generally inelastic.
Ex : Tobacco and alcohol.

9) Income Group :
The demand of higher income groups will be inelastic as they do not bother about price changes. On the other hand, the demand of middle and lower income groups will be elastic.

10) Postponement of Purchase :
The demand for a commodity, the consumption of which can be postponed is more elastic than that of the use of the commodity cannot be postpone the purchases of such goods like life saving medicines.

Question 7.
Describe the importance of price elasticity of demand.
Answer:
The term elasticity refers to the measure of extent of relationship between two related variables. The elasticity of demand is the measure of responsiveness or sensitiveness of demand for a commodity to the change in its demand.

Importance :
1) Useful to Monopolist :
Monopolist should study the elasticity of demand for his commodity before fixing up the price. Monopolist will fix a higher price when the commodity has inelastic demand, but he will fix a lower price when the commodity has elastic demand.

2) Useful to Joint Products :
It is useful in the price fixation of joint goods like meat and fur. In such case the producer will be guided by elasticity of demand to fix the prices of the joint goods.

3) Useful to the Government :
The concept of elasticity can be used in form using government policies relating public utility service like Railways, drug industry etc.

4) Useful to International Trade :
In calculating the terms of trade both countries have to take into account the mutual elasticities of demand for the products.

5) Useful to Finance Minister :
The concept of elasticity is useful to the Finance Minister in imposing taxes on goods. The finance minister studies the elasticity of commodities before he imposes new taxes or enhances old taxes.

6) Useful to Management :
Before asking for higher wages trade union leaders must know the elasticity of demand of the product produced by them. Trade union leaders may demand for higher wages only when the goods produced by them have inelastic demand.

7) Useful to Producers :
Volume of goods must be produced in accordance with demand for the commodity. Whenever, the demand for the commodity is inelastic, the producer will produce more commodities to take advantage of higher price. So, it helps in determining the volume of output.

Short Answer Questions

Question 1.
What are the factors that determine the demand?
Answer:
There are a number of factors that determine the demand for a good. The demand function shows the relationship between the demand and the factors that determine the demand for a good. The following are some of the important factors that determine demand :
1. Price of the Commodity :
The demand for a commodity is inversely related to its price. If the price of a commodity decreases its demand will increase and vice-versa. The demand for any good depends on its price being other things remaining constant. More quantity will be demanded at a lower price and vice-versa.

2. Prices of Substitutes and Complementaries :
Demand is also influenced by the changes in the prices of related goods i.e., either substitutes or complementaries. Prices of substitutes influence the demand for a commodity up to a certain extent. For instance, an increase in the price of coffee leads to an increase in the demand for tea. In case of substitutes, there exists a positive relationship between the price and the quantity demanded. Automobiles and fuel are complementary goods. In case of complementaries there exists a negative relationship between the price and the quantity demanded.

3. Income of the Consumer :
Income of the consumer is another important determinant. An increase in the income of a consumer leads to an increase in his purchasing power or quantity demanded. Being other things remaining constant, whenever the income of a consumer increases the demand for normal goods increases but the demand for inferior goods decreases.

4. Tastes and Preferences :
Demand for a commodity may change due to change in tastes, preferences and fashions. Tastes vary from person to person. Tastes do not remain the same forever. An increase in the use of trousers reduced the demand for dhotis due to change in fashions. Advertisements also influence the demand for a particular commodity.

5. Population :
Size of population of a country is another important determinant of demand. In other words, a change in the size of population will affect the demand for certain goods. For instance, larger the population more will be the demand for certain goods like food grains, clothes, housing etc.

6. Technological Changes :
Due to technical progress, new discoveries enter the market. As a result, old goods are substituted by new goods. For instance, increase in the demand for ‘cell phones’ reduced the demand for ‘land line’ phones.

7. Change in Weather :
Demand for a commodity may change due to a change in climatic conditions. For instance, during summer demand for cool drinks, cotton clothes and ACs increases. During winter demand for woolen clothes increases.

8. State of Business :
During the period of prosperity demand for commodities will expand and during depression demand will contract. Therefore, demand for goods depends on the state of business and economic activities.

TS Inter 1st Year Economics Study Material Chapter 3 Demand Analysis

Question 2.
Explain the Law of Demand.
Answer:
Demand means a desire which is backed up by ability to buy and willingness to pay the price is called demand in Economics. Thus, demand will be always to a price and time. Demand has the following features.

  1. Desire for the commodity.
  2. Ability to buy the commodity.
  3. Willing to pay the price of commodity.
  4. Demand is always at a price.
  5. Demand is per unit of time i.e, per day, week etc.

Therefore the price demand may be expressed in the form of small equation.
Dx = f(Px)

Price demand explains the relation between price and quantity demanded of a commodity. Price demand states that there is an inverse relationship between price and demand.

Law of demand :
Marshall defines the law of demand as, “The amount demanded increases with a fall in price and diminishes with a rise in price when other things remain the same”. So, the law of demand explains the inverse relationship between the price and quantity demanded of a commodity.

Demand schedule :
It means a list of the quantities demanded at various prices in a given period of time in a market. An imaginary example is given below.

Price in ₹Quantity Demanded in units
510
420
330
240
150

TS Inter 1st Year Economics Study Material Chapter 3 Demand Analysis 18
The table shows that as the price falls to ₹ 1/- the quantity demanded is 50 units, when price ₹ 5/- he is buying 10 units. So, there is inverse relationship between price and demand. Price is low demand will be high and price is high demand will be low. We can illustrate the above schedule in a diagram.

In the above diagram, on X-axis demand is shown and price is on Y-axis. DD is the demand curve. Demand curves slopes downward from left to right.

Assumptions :

  1. No change in the income of consumer.
  2. The taste and preferences of the consumers remain same.
  3. The prices of related goods remain the same.
  4. New substitutes are not discovered. ,
  5. No expectation of future price changes.

Question 3.
Explain the exceptions of law of Demand.
Answer:
In Economics demand means a desire which is backed up by ability to buy and willingness to pay the price. Thus demand will be always at a price and time.
TS Inter 1st Year Economics Study Material Chapter 3 Demand Analysis 19

According to Marshall “The amount demanded increases with a fall in price and diminishes with rise in price when other things remain the same”.

Exceptions :
In certain situations, more will be demanded at higher price and less will be demanded at a lower price. In such cases the demand curve slopes upward from left to right which is called an exceptional demand curve. This can be shown in the following diagram.

In the diagram when price increases from OP to OP1 demand also increases from OQ to OQ1 This is opposite to law of demand.

1) Giffen’s Paradox :
This was stated by Sir Robert Giffen. He observed that poor people will demand more of inferior goods, if their prices rise. Inferior goods are known as Giffen goods.
Ex : Ragee, Jowar etc. He pointed out that in case of the English workers, the law of demand does not apply to bread. Giffen noticed that workers spent a major portion of their income on bread and only small portion on meat.

2) Veblen Effect (Prestigious goods) :
This exception was stated by Veblen. Costly goods like diamonds and precious stones are called prestige goods or veblen goods. Generally rich people purchase those goods for the sake of prestige. Hence, rich people may buy more such goods when their prices rise.

3) Speculation :
When the price of a commodity rises the group of speculators expect that it will rise still further. Therefore, they buy more of that commodity. If they expect that there is a fall in price, the demand may not expand.
Ex : Shares in the stock market.

4) Illusion :
Sometimes, consumer develop to false idea that a high priced good will have a better quality instead of low priced good. If the price of such good falls, demand decreases, which is contrary to the law of demand.

Question 4.
Illustrate the reasons for negative sloping demand curve.
Answer:
According to Marshall, “The amount demanded increases with a fall in price and diminishes with a rise in price when other things remain the same”.

The law of demand explains inverse relationship between the price and quantity demanded of a commodity. Therefore, the demand curve slopes downward from left to right.
TS Inter 1st Year Economics Study Material Chapter 3 Demand Analysis 20

There are some other reasons also responsible for downward sloping demand curve.
1) Old and New Buyers :
If the price of a good falls, the real income of the old buyers will increase. Hence, the demand for the good will increase. In the same way, the fall in price attracts new buyers and will be able to built after a fall in its price. So the demand curve slopes downwards from left to right.

2) Income Effect :
Fall in price of commodity the real income of its consumers increase. The increase in real income encourages demand for the commodity with reduced price. The increase in demand on account of increased in real income is known as income effect.

3) Substitution Effect :
When the price of commodity falls, it will become relatively cheaper than its substitutes. The increase in demand on account of increase in real income is known as income effect.

4) Law of Diminishing Marginal Utility :
According to this law, if consumer goes on consuming more units of the commodity, the additional utility goes on diminishing. Therefore, the consumer prefers to buy at a lower price. As a result the demand curve has a negative slope.

TS Inter 1st Year Economics Study Material Chapter 3 Demand Analysis

Question 5.
Discuss the concept of income demand.
Answer:
Income demand :
It explains the relationship between consumers income and various quantities of various levels of income assuming other factors like price of goods, related goods, taste etc; remain the same. It means if income increases quantity demand increases and viceversa. This can be shown in the following form.
Dx = f(Y)

The functional relationship between income and demand may be inverse or direct depending on the nature of the commodity. This can be shown in the following table.

IncomeDemand
Superior goodInferior good
2000412
4000610
600088
8000106
10,000124

Superior goods :
In case of superior goods quantity demanded will increase when there is an increase in the income of consumers.
TS Inter 1st Year Economics Study Material Chapter 3 Demand Analysis 21

In the diagram ‘X’ axis represents demand, OY axis represents income, YD represents the income demand curve. It is showing positive slope whenever income increased from OY to OYx, the demand of superior or normal goods increases from OQ to OQ1

This may happen in case of Veblen goods.

Inferior goods :
On the contrary quantity demanded of inferior goods decreases with the increase in incomes of consumers.
TS Inter 1st Year Economics Study Material Chapter 3 Demand Analysis 22

In the diagram, on ’OX’ axis measures demand and OY axis represents income of the consumer. When the consumer income increases from OY to OY1 the demand for a com-modity decreases from OQ to OQ1 So the YD’ curve is negative sloping.

Question 6.
Explain the concept of Cross Demand.
Answer:
Cross demand :
Cross demand refers to the relationship between any two goods which are either complementary to each other or substitute for each other. It explains the functional relationship between the price of one commodity and quantity demanded of another commodity is called cross demand.
Dx = f(Py)
Where, Dx = demand for ‘X’ commodity
Py = Price of y commodity
f = function
TS Inter 1st Year Economics Study Material Chapter 3 Demand Analysis 23

Substitutes :
The goods which satisfy the same want are called substitutes.
Ex : Tea and coffee; pepsi and coca-cola etc. In the case of substitutes, the demand curve has a positive slope.

In the diagram ‘OX’ axis represents demand of tea and OY axis represents price of coffee. Increase in the price of coffee from OY to OY2 leads to increase in the demand of tea from OQ to OQ2.

Complementaries :
In case of complementary goods, with the increase in price of one commodity, the quantity demanded of another commodity falls.
Ex: Car and Petrol. Hence, the demand curve of these goods slopes downward to the right.
TS Inter 1st Year Economics Study Material Chapter 3 Demand Analysis 24

In the diagram if price of car decreases from OP to OP2 the quantity demand of petrol increases from OQ to OQ2. SO cross demand i.e., CD curve is downward sloping.

Question 7.
What is elasticity of demand?
Answer:
In Economic theory, the concept of elasticity of demand has a significant role. Elasticity of demand means the percentage change in quantity demanded in response to the percentage change in one of the variables on which demand depends.

Elasticity of demand changes from person to person, place to place, time to time and one commodity to another.

Accoridng to Marshall, “The elasticity of demand in a market is great or small according as the amount demanded increases much or little for a given fall in price”.

The concept of elasticity of demand explains how much or to what extent a change in any one of the independent variables leads to a change in the dependent variable.

There are three kinds of elasticity of demand.

  1. Price Elasticity of demand
  2. Income Elasticity of demand
  3. Cross Elasticity of demand.

Question 8.
Define Price Elasticity of demand.
Answer:
Price elasticity of demand is the responsiveness of quantity demanded of a good to a change in the price of that commodity. Alfred Marshall developed the concept of price elasticity of demand. A change in the price of a particular good will never bring uniform change in the quantity demanded.

Other things remaining constant, price elasticity measures the change in the quantity demanded of a good in response to a change in its price. Thus, price elasticity of demand is the ratio of percentage change in quantity demanded of a good and percentage change in its price.

Prof. Marshall suggested the following formula to measure price elasticity of demand.
TS Inter 1st Year Economics Study Material Chapter 3 Demand Analysis 25
Where, q = quantity; p = price;
∆q = change in demand; ∆p = change in price

It is to be noted that while calculating price elasticity of demand other things like income, prices of all related goods, tastes, preference etc. are assumed to be constant. It is also to be noted that price elasticity of demand is negative because of the inverse relationship between price and quantity demanded. For the sake of convenience or simplicity the minus sign is ignored and only the numerical value of the elasticity coefficient is considered.

Types of Price Elasticity of Demand :
If the price of a commodity increases, its quantity demanded will fall. The rate of change in demand is not always proportionate to the rate of change in price. For some commodities a smaller change in price leads to a greater change in quantity demanded. In such a case, the demand is elastic on the other hand, even a greater change in price may lead to only a smaller change in the quantity demanded. In such a case, we say that the demand is inelastic. The following are the types of elasticity of demand :

  1. Perfectly Elastic demand (Ed = ∞)
  2. Perfectly Inelastic demand (Ed = 0)
  3. Unitary Elastic demand (Ed = 1)
  4. Relatively Elastic demand (Ed > 1) and
  5. Relatively Inelastic demand (Ed < 1).

TS Inter 1st Year Economics Study Material Chapter 3 Demand Analysis

Question 9.
What are the basic determinants of price elasticity of demand?
Answer:
It is not easy to say that the demand for a commodity is elastic or inelastic. Elasticity of demand for a commodity varies from person to person, place to place and time to time. Many factors determine the degree of elasticity. Among them, the following are some of the important factors on which elasticity of demand for a commodity depends.

1) Nature of the Commodity :
In case of necessaries, the elasticity of demand will be inelastic. For example, rice, pulses, sugar and salt. Though the prices of these necessaries change, the quantity demanded remains the same. On the other hand, in case of luxuries the demand is more elastic. Ex. demand for gold, diamonds and other costly goods are more elastic.

2) Availability of Close Substitutes :
Prices of substitutes influece the demand for a commodity up to a certain extent. For instance, an increase in the price of Colgate leads to an increase in the demand for Close Up and vice versa. In case where substitute are available the elasticity of demand will be high but in case of non-availability of substitutes the elasticity of demand will be low.

3) Complementary Goods :
Car and fuel or shoes and socks are used jointly because they are complementaries. For instance, if the price of car increases the demand for fuel decreases and if the price of car decreases the demand for fuel increases. If the demand of car is elastic, then the demand for petrol will also be elastic and viceversa.

4) Multiple Uses of the Commodity :
The more the possible uses of commodity the greater will be its price elasticity and vice versa. Let us illustrate with an example of milk which has several uses. If its price falls, it can be used for a variety of purposes like preparation of curd, cream, ghee and sweets. But if its price rises, its use will be restricted only to feed children and sick persons. Similarly, coal and electricity have multiple uses and will have elastic demand.

5) Postponement of Purchases :
One can certainly postpone the purchases of certain goods like vehicles, ornaments and AC units from present to furture as they have elastic demand. But in case of life saving medicines the demand wall be inelastic, as we cannot postpone the purchases of such goods even if the prices of medicines increase.

6) Proportion of Income Spent :
If the propotion of income spent On a particular commodity is very small, demand for it will tend to be inelastic. For instance, demand for salt, newspapers, match boxes etc. is inelastic. Others like ACs, vehicles etc. will have elastic demand because a major amount has to be allotted to purchase these goods.

7) Period of Time :
In the long run, demand will be more elastic. Longer the time period considered, greater will be the possibility of substitution for a cheaper good. For example, if the price of petrol increases in the short run, it may not be possible to replace the petrol engines with diesel engines but in the long run, it can be possible to replace petrol engines because diesel is now relatively cheaper.

8) Price Level :
If the price of a good is too high or too low, then the elasticity of demand for these goods will be inelastic. On the other hand, if the price is moderate, then the elasticity of demand of these goods will be elastic.

9) Goods Leading to Addiction :
In case of habit forming commodities like tobacco and alcohol, the demand for such goods will tend to be inelastic. Consumers who are accustomed to these goods will buy them even if the prices of these goods increase.

10) Income Group :
The economy consists of the various income groups. In general, the demand for major commodities purchased by higher income groups will be inelastic as they do not bother about price changes. On the other hand, the demand of middle and lower income groups will be elastic as they will be very sensitive to price changes.

Thus, it will be difficult to say whether a commodity has elastic or inelastic demand.

Question 10.
Point out the importance of price elasticity of demand.
Answer:
There are several uses of price elasticity of demand both for business and government particularly in decision making. The following are the some of the important areas where price elasticity of demand is useful.

1) Monopoly Market :
If the demand for a product has different elasticities in different markets, the producer can fix different prices in different markets. A monopolist will fix a higher price when the commodity has inelastic demand but he will fix a lower price when the commodity has elastic demand.

2) Joint Products :
The elasticity of demand is useful in the price fixation of joint goods like meat and fur, sugar and molasses etc. It is too difficult to ascertain separate costs of these joint goods. In such a case, the producer will be guided by elasticity of demand to fix the prices of joint goods. So, a higher price is fixed for a good with inelastic demand and lower price for a good with elastic demand.

3) Government :
The commodities of some industries have inelastic demand. Such industries are declared as ‘public utilities’. Keeping in view the welfare of the people, the government will undertake these industries which have inelastic demand. Railways is one of the best examples.

4) International Trade :
Trade between two countries is possible only by taking into consideration the mutual elasticities of demand for each other’s products. Terms of trade’ implies the rate at which one unit of domestic commodity will exchange for unit of a foreign commodity. In claculating the terms of trade, both countries have to take into account the mutual elasticities of demand for their products.

5) Ministry of Finance :
The government imposes taxes for revenue. While imposing taxes on commodities, the finance minister selects different goods based on their price elasticities. When the government is in need of more revenue it chooses those commodities which have inelastic demand for tax imposition.

6) Management :
If the demand for workers is inelastic, the demand of trade unions to rasie wages will be fruitful. If the demand for workers is elastic, the efforts of trade unions to raise wages may not be successful.

7) Prosperity in Midst of Plenty :
The concept of elasticity explains the paradox of poverty i.e., poverty in the midst of plenty. For instance, bumper crop of food grains should bring agricultural prosperity. But due to inelastic nature of food grains demand, the agricultural sector receives low prices for the produce.

8) Producers :
Volume of goods must be produced in accordance with demand for the commodity. Whenever the demand for the commodity is inelastic, the producer will produce more commodities to take advantage of higher price. Hence, elasticity of demand helps in determining the volume of output.

TS Inter 1st Year Economics Study Material Chapter 3 Demand Analysis

Question 11.
Describe the income and cross elasticities of demand.
Answer:
The income elasticity of demand and cross elasticity of demand are as follows.

Income Elasticity of Demand :
Income elasticity of demand shows the degree of re-sponsiveness of quantity demanded of a commodity to a change (increase or decrease) in the income of the consumer, other things remaining constant.
TS Inter 1st Year Economics Study Material Chapter 3 Demand Analysis 26
Where, q = quantity, y = income, ∆q = change in quantity demanded,
∆y = change in income.

Cross Elasticity of Demand :
Cross elasticity of demand refers to the change (increase or decrease) in the quantity demanded of a good in response to the change (increase or decrease) in the price of its related goods, other things remaining constant. There are certain goods whose demand depends not only on their price but also on the prices of related goods.
TS Inter 1st Year Economics Study Material Chapter 3 Demand Analysis 27

Where, Qx = quantity demanded for commodity x, Py = price of commodity Y, ∆Qx = change in quantity demanded for commodity X, and ∆Py = change in price of commodity Y.

Very Short Answer Questions

Question 1.
What is Price Demand?
Answer:
It explains the functional relationship between price of good and quantity demanded when the remaining factors are constant. It shows inverse relationship between price and demand.
Dx = f(Px)
Dx = Demand for X commodity
Px = Price of X

Question 2.
Prepare Individual Demand Schedule.
Answer:
It explains the relationship between various quantities purchased at various prices by a single consumer in the market.

TS Inter 1st Year Economics Study Material Chapter 3 Demand Analysis

Question 3.
Prepare Market Demand Schedule.
Answer:
It shows the total demand for a group at a particular time at different prices in the market.

Question 4.
What is Demand Function?
Answer:
Demand function shows the functional relationship between quantity demanded at various factors that determine the demand for a commodity. It can be expressed as follows.
Dx = f(Px, P1, …………. Pn, Y, T)
Where,
Dx = Demand for good X
Px = price of X
Pi1 …. Pn = Prices of substitutes and complementary
Y = Income of consumer
T = Tastes
f = functional relationship

Question 5.
Explain Giffen’s Paradox (or) Giffen Goods.
Answer:
It means necessary goods. Sir Robert Giffen in mid 19th century observed that the low paid workers in England purchased more bread when its price increased by decreasing in the purchase of meat. The increase in demand for bread when price increased is an exception to the law of demand, it is known as Giffen’s Paradox.

Question 6.
Explain Veblen Goods (or) Prestigious Goods.
Answer:
This is associated with the name of T. Veblen. Costly goods like diamonds and cars are called Veblen goods. Generally rich people purchase those goods for the sake of prestige. Hence, rich people may buy more such goods when their prises rise.

Question 7.
What is Income Demand?
Answer:
It shows the direct relationship between the income of the consumer and quantity demanded when the other factors remain constant. There is direct relationship between income and demand for superior goods. Inverse relationship between income and demand for inferior goods.
Dx = f(Y)

TS Inter 1st Year Economics Study Material Chapter 3 Demand Analysis

Question 8.
What is Cross Demand?
Answer:
Cross demand refers to the relationship between any two goods which are either complementary to each other or substitute of each other at different prices.
Dx = f(Py)

Question 9.
Explain Substitute goods.
Answer:
These are goods which satisfy the same want.
Ex : Tea and coffee. In this case the relationship between demand for a product and the price of its substitute is positive in its nature.

Question 10.
Explain Complementary Goods.
Answer:
These are goods which satisfy the same wants jointly.
Ex: Shoes and socks, car and petrol. The relationship between complementary goods is inverse.

Question 11.
What is Price Elasticity of Demand?
Answer:
It is the percentage change in quantity demanded of a commodity as a result of percentage change in price of a commodity.
TS Inter 1st Year Economics Study Material Chapter 3 Demand Analysis 28

Question 12.
What are the types of price elasticity of demand?
Answer:
If the price of a commodity increases, its quantity demanded will fall. The rate of change in demand is not always proportionate to the rate of change in price. For some commodities a smaller change in price leads to a greater change demand, here the demand is elastic. A greater change in price many lead to only a smaller change in quantity demanded, here the demand is inelastic. The following are the types of elasticity of demand.
a) Perfectly elastic demand.
b) Perfectly inelastic demand,
c) unitary elastic demand.
d) Relatively elastic demand,
e) Relatively inelastic demand.

Question 13.
Explain Income Elasticity of Demand.
Answer:
It is the percentage change in quantity demanded of a commodity as a result of percentage change in the income of the consumer.
TS Inter 1st Year Economics Study Material Chapter 3 Demand Analysis 29

Question 14.
Explain Cross Elasticity of Demand.
Answer:
It is the percentage change in the quantity demanded of a commodity as a result of proportional change in the price of related commodity.
TS Inter 1st Year Economics Study Material Chapter 3 Demand Analysis 30

Question 15.
What is Perfectly Elastic Demand?
Answer:
If a negligible change in price leads to an infinite change in demand is called perfectly elastic demand. In this case the demand curve is horizontal to ‘X’ axis.

TS Inter 1st Year Economics Study Material Chapter 3 Demand Analysis

Question 16.
What is Perfectly Inelastic Demand?
Answer:
Even a great rise or fall in price does not lead and change in quantity demanded is known as perfectly inelastic demand. The demand curve is vertical to ‘Y axis.

Question 17.
Explain Unitary Elastic Demand.
Answer:
The proportionate change in demand is equal to the proportionate change in price. In this case the demand curve will be a rectangular hyperbola.

Question 18.
Explain Relatively Elastic Demand.
Answer:
When a proportionate change in price leads to more than proportionate change in quantity demand is called relatively elastic demand.

Question 19.
Explain Relatively Inelastic Demand.
Answer:
When the proportionate change in price leads to a less than proportionate change in quantity demanded is called relatively inelastic demand.

Question 20.
Define Superior goods.
Answer:
In case of superior or normal goods, quantity demanded increases when there is an increase in the income of consumers. Income demand for superior goods exhibits a positive relationship between the income and quantity demanded. In such a case, the demand curve slopes upwards from left to right.
TS Inter 1st Year Economics Study Material Chapter 3 Demand Analysis 31

In figure OX-axis represents quantity demanded for superior goods and OY-axis rep-resents the income of the consumer. YD represents the income demand curve showing a positive slope. Whenever income increases from OY to OY1 the quantity demanded of superior or normal goods increases from OQ to OQ1 This may happen in case of Veblen goods.

TS Inter 1st Year Economics Study Material Chapter 3 Demand Analysis

Question 21.
Define Inferior Goods.
Answer:
The goods whose income elasticity of demand is negative for levels of income are termed as inferior goods. In case of inferior goods if income increases demand decreases and vice-versa. The income demand for inferior goods has a negative slope.