Telangana TSBIE TS Inter 1st Year Economics Study Material 3rd Lesson Demand Analysis Textbook Questions and Answers.
TS Inter 1st Year Economics Study Material 3rd Lesson Demand Analysis
Long Answer Questions
Question 1.
What is a Demand Function? What are the factors that determine the demand for a good?
Answer:
The functional relationship between the demand for a commodity and its various determinants may be explained mathematically in terms of a demand function.
Dx = f(Px, P1 Pn, Y, T)
Where, Dx = Demand for good X;
Px = price of X;
P1 …. Pn = Prices of substitutes and complementaries
Y Income,
T = Taste of the consumer.
Determinants of demand:
1) Price of commodity :
The demand for any good depends on its price, more will be demanded at lower price and vice-versa.
2) Prices of substitutes and complementaries :
Demand is influenced by changes in price of related goods either substitutes or complementary goods.
Ex : Increase in the price of coffee leads an increase in the demand for tea in the case of substitutes positive relation and complementaries negative relationship between price and demand.
3) Income of the consumer :
Demand always changes with a change in the incomes of the people. When income increases the demand for several commodities increases and vice-versa.
4) Population :
A change in the size and composition of population will effect the demand for certain goods like food grains, clothes etc.
5) Taste and preferences :
A change in the taste and the fashions bring about a change in the demand for a commodity.
6) Technological changes :
Due to economic progress technological changes the quantity the quality of goods available to the consumers increase.
Ex : Demand for cell phones reduced the demand for landline phones.
7) Change in the weather :
Demand for commodity may change due to a change in climatic condition.
Ex : During summer demand for cool drinks, in winter demand for woollen clothes.
8) State of business :
During the period of prosperity, demand for commodities will expand and during depression demand will contract.
![]()
Question 2.
Explain the law of demand and examine its exceptions.
Answer:
Demand means a desire which is backed up by ability to buy and willingness to pay the price is called Demand in Economics. Thus demand will be always to a price and time. Demand has the following features.
- Desire for the commodity.
- Ability to buy the commodity.
- Willing to pay the price of commodity.
- Demand is always at a price.
- Demand is per unit of time i.e., per day, week etc.
Therefore, the price demand may be expressed in the form of small equation.
Dx = f(Px)
Price demand explains the relation between price and quantity demanded of a commodity. Price demand states that there is an inverse relationship between price and demand.
Law of demand :
Marshall defines the law of demand as, “The amount demanded increases with a fall in price and diminishes with a rise in price when other things remain the same”. So, the law of demand explains the inverse relationship between the price and quantity demanded of a commodity.
Demand schedule :
It means a list of the quantities demanded at various prices in a given period of time in a market. An imaginary example given below.
| Price in ₹ | Quantity Demanded units |
| 5 | 10 |
| 4 | 20 |
| 3 | 30 |
| 2 | 40 |
| 1 | 50 |
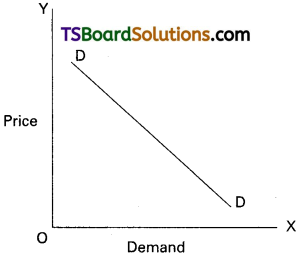
The table shows that as the price falls to ₹ 1/- the quantity demanded 50 units, when price ₹ 5/- he is buying 10 units. So, there is inverse relationship between price and demand. Price is low demand will be high and price is high demand will be low. We can illustrate the above schedule in a diagram.
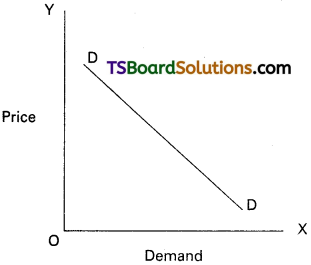
In the above diagram on X-axis demand is shown and price is on Y-axis. DD is the demand curve. Demand curve slopes downwards from left to right.
Assumptions :
- No change in the income of consumer.
- The taste and preferences consumers remain same.
- The prices of related goods remain the same.
- New substitutes are not discovered.
- No expectation of future price changes.
Exceptions :
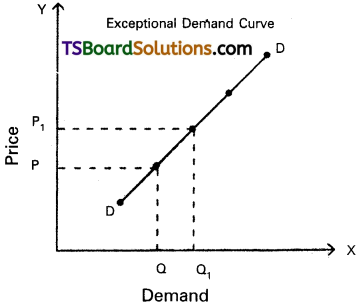
In certain situations, more will be demanded at higher price and less will be demanded at a lower price. In such cases the demand curve slopes upward from left to right which is called an exceptional demand curve.
This can be shown in the following diagram.
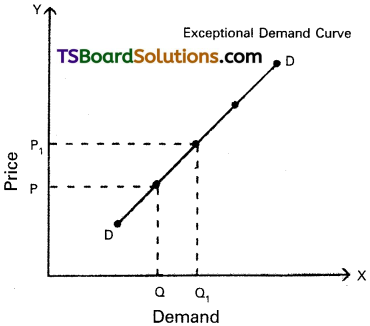
In the diagram when price increases from OP to OP1, demand also increases from OQ to OQ1 This is opposite to law of demand.
1) Giffen’s Paradox :
This was stated by Sir Robert Giffen. He observed that poor people will demand more of inferior goods, if their prices rise. Inferior goods are known as Giffen goods.
Ex : Ragee, Jowar etc. He pointed out that in case of the English workers, the law of demand does not apply to bread. Giffen noticed that workers spend a major portion of their income on bread and only small portion on meat.
2) Veblen Effect (Prestigious goods) :
This exception was stated by Veblen. Costly goods like diamonds and precious stones are called prestige goods or veblen goods. Generally, rich people purchase those goods for the sake of prestige. Hence, rich people may buy more such goods when their prices rise.
3) Speculation :
When the price of a commodity rises the group of speculators expect that it will rise still further. Therefore, they buy more of that commodity. If they expect that there is a fall in price, the demand may not expand.
Ex : Shares in the stock market.
4) Illusion :
Sometimes, consumer develop to false idea that a high priced good will have a better quality instead of low priced good. If the price of such good falls, demand decreases, which is contrary to the law of demand.
![]()
Question 3.
Explain the concepts of income and cross demands with suitable diagrams.
Answer:
The concept of demand has great significance in economics. In general language, demand means a desire but in economics the desire backed up by ability to buy and willingness to pay the price.
Types of demands :
The demand may be classified into 3 types.
- Price demand.
- Income demand.
- Cross demand.
1) Price demand :
Price demand explains the relationship between price and quantity demanded of a commodity it shows the inverse relationship between price and demand when the other things like consumer’s income, taste etc., remains constant. It means the price falls demand extends and price rises demand contracts. The price demand can be expressed Dx = f(Px)
Price demand can be explained with the help of demand schedule.
| Price | Quantity Demanded |
| 5 | 10 |
| 4 | 20 |
| 3 | 30 |
| 2 | 40 |
| 1 | 50 |
As price falls to ₹ 1/- the quantity demand is 50 units, when price of apple is ₹ 5/- he is buying 10 units. So, the table shows inverse relationship between price and demand.
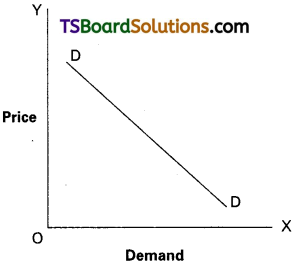
Price demand can be explained with the help of the demand curve.
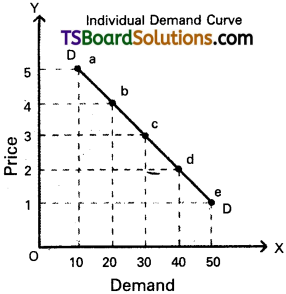
On OX axis shows demand, OY axis shows price. We can obtain the demand curve ‘DD’ by joining all the points A, B, C, D, E which represents various quantities of demand at various prices. ‘DD’ is demand curve. It slopes downwards from left to right. It shows the inverse relationship between price and demand.
2) Income demand :
It explains the relationship between consumer’s income and various quantities of various levels of income assuming other factors like price of goods, related goods, taste etc., remain the same. It means if income increases quantity demand increases and vice-versa. This can be shown in the following form.
Dx = f(Y)
The functional relationship between income and demand may be inverse or direct depending on the nature of the commodity. This can be shown in the following table.
| Income | Demand | |
| Superior good | Inferior good | |
| 2,000 | 4 | 12 |
| 4,000 | 6 | 10 |
| 6,000 | 8 | 8 |
| 8,000 | 10 | 6 |
| 10,000 | 12 | 4 |
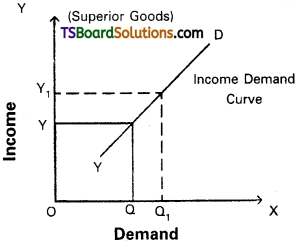
Superior goods :
In case of superior goods quantity demanded will increase when there is an increase in the income of consumers.
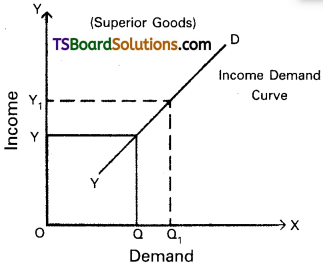
In the diagram ‘X’ axis represents demand, OY axis represents income, YD represents the income demand curve. It showing positive slope whenever income increased from OY to OY1; the demand of superior or normal goods increases from OQ to OQ1.
This may happen in case of Veblen goods.
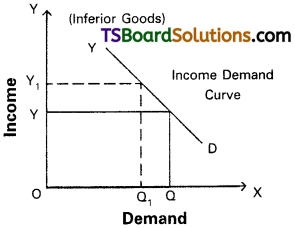
Inferior goods :
On the contrary quantity demanded of inferior goods decreases with the increase in incomes of consumers.
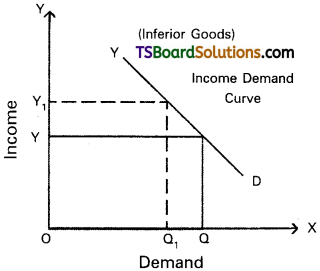
In the diagram on ‘OX’ axis measures demand and OY axis represents income of the consumer. When the consumer income increases from OY to OY1 the demand for a commodity decreases from OQ to OQ1 So the YD’ curve is negative sloping.
3) Cross demand :
Cross demand refers to the relationship between any two goods which are either complementary to each other or substitute for each other. It explains the functional relationship between the price of one commodity and quantity demanded of another commodity is called cross demand.
Dx = f(Py)
Where, Dx = demand for ‘X’ commodity
Py = Price of ‘Y’ commodity
f = function
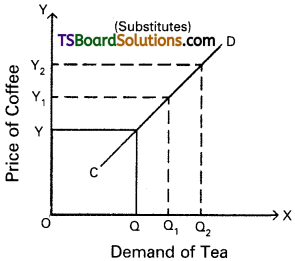
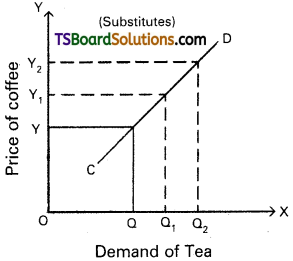
Substitutes :
The goods which satisfy the same want are called substitutes.
Ex: Tea and coffee; pepsi and coca-cola etc. In the case of substitutes, the demand curve has a positive slope.
In the diagram ‘OX’ axis represents demand of tea and OY axis represents price of coffee. Increase in the price of coffee from OY to OY2 leads to increase in the demand of tea from OQ to OQ2.
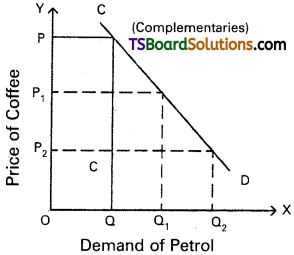
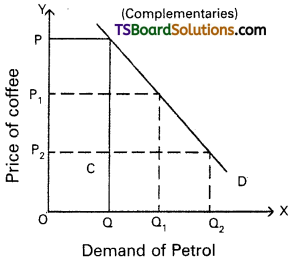
Complementaries :
In case of complementary goods, with the increase in price of one commodity, the quantity demanded of another commodity falls. Ex: Car and Petrol. Hence, the demand curve of these goods slopes downward to the right.
In the diagram, if price of car decreases from OP to OP2 the quantity demand of petrol increases from OQ to OQ2. So cross demand i.e., CD curve is downward sloped.
Question 4.
Define the concept of elasticity demand. Also explain income and cross elasticities of demand.
Answer:
The concept of elasticity demand was first introduced by Cournot and Mill. Later it was developed in a scientific manner by Marshall. Elasticity of demand means the degree of sensitiveness or responsiveness of demand to a change in its price.
According to Marshall, “The elasticity of demand in a market is great or small according as the amount demanded increases much or little for a given fall in price”.
The concept of elasticity of demand explains how much or to what extent a change in any one of the independent variables leads to change in the dependent variable.
There are three kinds of elasticity of demand.
- Price elasticity of demand
- Income elasticity of demand
- Cross elasticity of demand
1) Price Elasticity of Demand :
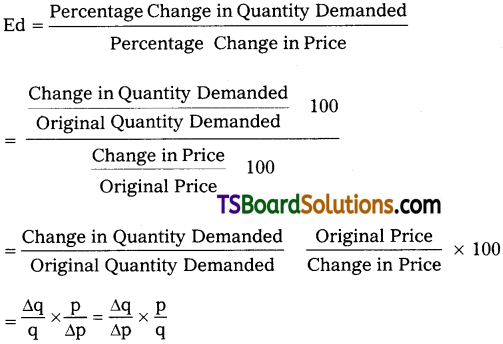
Alfred Marshall developed the concept of price elasticity of demand. Price elasticity of demand is generally defined as the degree of respon siveness or sensitiveness of demand for a commodity to the changes in its price. Thus, price elasticity of demand is the ratio of percentage change in quantity demanded of a good and percentage change in its price. The following formula to measure price elasticity of demand
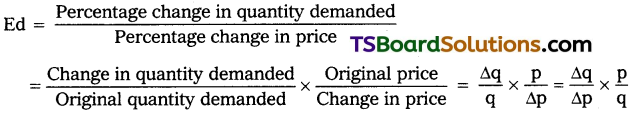
where, q= quantity; p = price; ∆q = change in quantity demanded;
∆p = change in price.
There are five kinds of price elasticity of demand. They are :
- Perfectly Elastic demand (Ed = ∝)
- Perfectly Inelastic demand (Ed = 0)
- Unitary Elastic demand (Ed = 1)
- Relatively Elastic demand (Ed > 1)
- Relatively Inelastic demand (Ed < 1)
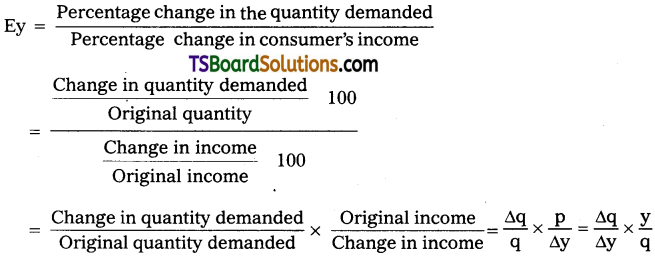
2) Income Elasticity of Demand :
Income elasticity of demand shows the degree of responsiveness of quantity demanded of a commodity to a change in the income of the consumer, other things remain constant.
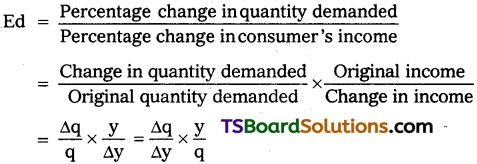
where, q = Quantity; y = income; ∆Q = change in quantity demanded;
∆y = change in income.
Income elasticity of demand will be positive in case of superior goods like milk and meat and negative in case of inferior goods like porridge and broken rice.
3) Cross Elasticity of Demand :
Cross elasticity of demand refers to change in the quantity demanded of one good in response to change in the price of related good, other things remaining constant. There are certain goods whose demand depend not only on their price but also on the prices of related goods.
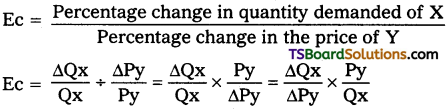
Where, Q(x) = Quantity demanded for X; P(y) = price of commodity (Y), ∆Q(x) = change in quantity demanded of X commodity, ∆P(y) = change in price of commodity Y.
Substitute goods like tea and coffee have positive cross elasticity demand where as complementary goods like shoes and socks have negative cross elasticity of demand.
![]()
Question 5.
What is price elasticity of demand? Illustrate the various types of price elasticities of demand.
Answer:
Alfred Marshall developed the concept of price elasticity of demand. Price elasticity measures, other things remaining constant, change in the demanded of a good in response to a change in its price. Thus, price elasticity of demand is the ratio of percentage change in quantity demanded of a good and percentage change in its price. Price elasticity can be written as stated below.
![]()
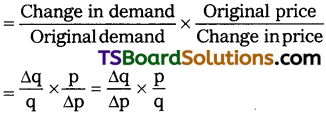
Where, q = quantity; p = price; ∆q = change in demand; ∆p = change in price
Types of Price Elasticity of Demand : Based on numerical value, price elasticity of demand can be of five types.
- Perfectly Elastic demand (Ed = ∞)
- Perfectly Inelastic demand (Ed = 0)
- Unitary Elastic demand (Ed = 1)
- Relatively Elastic demand (Ed > 1)
- Relatively Inelastic demand (Ed < 1)
1) Perfectly Elastic demand :
It is also known as “in-finite elastic demand”. A small change in price leads to an infinite change in demand is called perfectly elastic demand. It is horizontal straight line to ‘X’ axis. The numerical value of perfectly elastic demand is infinite (Ed = ∞). It can be shown in the diagram.
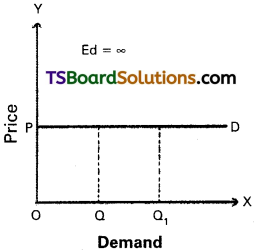
In the diagram, Ed = \(\frac{OQQ_1}{OQ}\) ÷ \(\frac{O}{OP}\)
\(\frac{QQ_1}{OQ}\) × \(\frac{OP}{O}\) = ∞
2) Perfectly Inelastic demand :
It is also known as “zero elastic demand”. In this case even a great rise or fall in price does not lead to any change in quantity demanded is known as perfectly inelastic demand. The demand curve will be vertical to the Y axis. The numerical value is ‘O’. This can be shown in the following diagram.
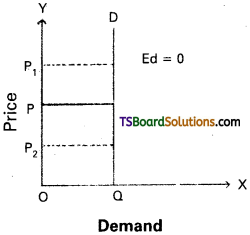
In the diagram, Ed = \(\frac{O}{OQ}\) ÷ \(\frac{PP_1}{OP}\) = 0
∴ Ed = 0
3) Unitary Elastic demand :
The percentage change in price leads to same percentage change in demand is called unitary elastic demand. In this case the elasticity of demand is equal to one. The shape of demand curve is “Rectangular Hyperbola”. This can be shown in the following.
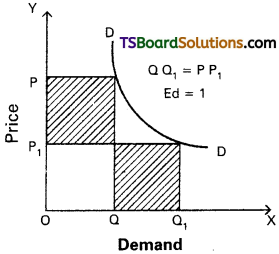
In the diagram, Ed = OP1Q1 = OPQ
(or) OQ1 = PP1
∴ Ed = 1
4) Relatively Elastic demand :
When a percentage change in price leads to more than percentage change in quantity demand is called relatively elastic demand. In this case the numerical value of Ed is greater than one (Ed > 1)
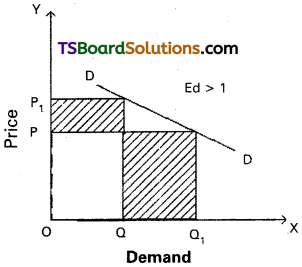
In the diagram, Ed = OQ1 > PP1
∴ Ed > 1
5) Relatively Inelastic demand :
When the percentage change in price leads to a less than percentage change in quantity demand is called relatively inelastic demand. Here the numerical value is less than one (Ed < 1). This can be shown to following diagram.
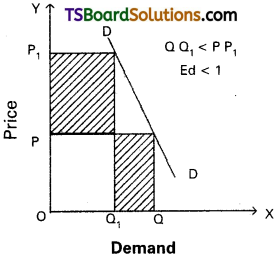
In the diagram, Ed = QQ1 < PP1
∴ Ed < 1
Question 6.
Discuss the factors that determine price elasticity of demand.
Answer:
The term elasticity refers to the measure of extent of relationship between two related variables. The elasticity of demand is the measure of responsiveness or sensitiveness of demand for a commodity to the change in its demand.
Determinants of Elasticity of Demand :
The elasticity of demand varies from commodity to commodity.
1) Nature of Commodity :
Commodities can be grouped as necessaries, comforts and luxuries. In case of necessaries, the elasticity of demand will be inelastic.
Ex : Rice, salt etc. On the other hand in case of luxuries the demand will be more elastic.
Ex : Diamonds and gold etc.
2) Availability of Substitutes :
Prices of substitutes influence the demand for a commodity up to a certain extent. The closer the substitute, the greater the elasticity of demand for the commodity. Ex: Cool drinks, soaps etc., but in case of non-availability of substitutes the elasticity of demand will be low.
3) Complementary Goods :
Price elasticity for a good is also depends on the nature of price elasticity of jointly demand goods. If the demand for car is elastic, then the demand for petrol will also be elastic.
4) Multiple Uses of the Commodity :
The wider the range of alternative uses of a product, the higher the elasticity of demand and vice-versa.
Ex : Coal and electricity have multiple uses and will have elastic demand.
5) Proportion of Income Spent :
If proportion of income spent on commodity is very small, its demand will be less elastic and vice-versa.
6) Period of time :
In the long run, demand will be more elastic. Longer the time period considered, greater will be the possibility of substitution for a cheaper good.
Ex : If the price of petrol increases in the short run, it may not be possible to replace the petrol engines with diesel engines but in the long run it can be possible.
7) Price Level :
Goods which are in very high range or in very low range have inelastic demand but it is high at moderate price.
8) Habit :
The demand for a commodity to which the consumer is accustomed is generally inelastic.
Ex : Tobacco and alcohol.
9) Income Group :
The demand of higher income groups will be inelastic as they do not bother about price changes. On the other hand, the demand of middle and lower income groups will be elastic.
10) Postponement of Purchase :
The demand for a commodity, the consumption of which can be postponed is more elastic than that of the use of the commodity cannot be postpone the purchases of such goods like life saving medicines.
Question 7.
Describe the importance of price elasticity of demand.
Answer:
The term elasticity refers to the measure of extent of relationship between two related variables. The elasticity of demand is the measure of responsiveness or sensitiveness of demand for a commodity to the change in its demand.
Importance :
1) Useful to Monopolist :
Monopolist should study the elasticity of demand for his commodity before fixing up the price. Monopolist will fix a higher price when the commodity has inelastic demand, but he will fix a lower price when the commodity has elastic demand.
2) Useful to Joint Products :
It is useful in the price fixation of joint goods like meat and fur. In such case the producer will be guided by elasticity of demand to fix the prices of the joint goods.
3) Useful to the Government :
The concept of elasticity can be used in form using government policies relating public utility service like Railways, drug industry etc.
4) Useful to International Trade :
In calculating the terms of trade both countries have to take into account the mutual elasticities of demand for the products.
5) Useful to Finance Minister :
The concept of elasticity is useful to the Finance Minister in imposing taxes on goods. The finance minister studies the elasticity of commodities before he imposes new taxes or enhances old taxes.
6) Useful to Management :
Before asking for higher wages trade union leaders must know the elasticity of demand of the product produced by them. Trade union leaders may demand for higher wages only when the goods produced by them have inelastic demand.
7) Useful to Producers :
Volume of goods must be produced in accordance with demand for the commodity. Whenever, the demand for the commodity is inelastic, the producer will produce more commodities to take advantage of higher price. So, it helps in determining the volume of output.
Short Answer Questions
Question 1.
What are the factors that determine the demand?
Answer:
There are a number of factors that determine the demand for a good. The demand function shows the relationship between the demand and the factors that determine the demand for a good. The following are some of the important factors that determine demand :
1. Price of the Commodity :
The demand for a commodity is inversely related to its price. If the price of a commodity decreases its demand will increase and vice-versa. The demand for any good depends on its price being other things remaining constant. More quantity will be demanded at a lower price and vice-versa.
2. Prices of Substitutes and Complementaries :
Demand is also influenced by the changes in the prices of related goods i.e., either substitutes or complementaries. Prices of substitutes influence the demand for a commodity up to a certain extent. For instance, an increase in the price of coffee leads to an increase in the demand for tea. In case of substitutes, there exists a positive relationship between the price and the quantity demanded. Automobiles and fuel are complementary goods. In case of complementaries there exists a negative relationship between the price and the quantity demanded.
3. Income of the Consumer :
Income of the consumer is another important determinant. An increase in the income of a consumer leads to an increase in his purchasing power or quantity demanded. Being other things remaining constant, whenever the income of a consumer increases the demand for normal goods increases but the demand for inferior goods decreases.
4. Tastes and Preferences :
Demand for a commodity may change due to change in tastes, preferences and fashions. Tastes vary from person to person. Tastes do not remain the same forever. An increase in the use of trousers reduced the demand for dhotis due to change in fashions. Advertisements also influence the demand for a particular commodity.
5. Population :
Size of population of a country is another important determinant of demand. In other words, a change in the size of population will affect the demand for certain goods. For instance, larger the population more will be the demand for certain goods like food grains, clothes, housing etc.
6. Technological Changes :
Due to technical progress, new discoveries enter the market. As a result, old goods are substituted by new goods. For instance, increase in the demand for ‘cell phones’ reduced the demand for ‘land line’ phones.
7. Change in Weather :
Demand for a commodity may change due to a change in climatic conditions. For instance, during summer demand for cool drinks, cotton clothes and ACs increases. During winter demand for woolen clothes increases.
8. State of Business :
During the period of prosperity demand for commodities will expand and during depression demand will contract. Therefore, demand for goods depends on the state of business and economic activities.
![]()
Question 2.
Explain the Law of Demand.
Answer:
Demand means a desire which is backed up by ability to buy and willingness to pay the price is called demand in Economics. Thus, demand will be always to a price and time. Demand has the following features.
- Desire for the commodity.
- Ability to buy the commodity.
- Willing to pay the price of commodity.
- Demand is always at a price.
- Demand is per unit of time i.e, per day, week etc.
Therefore the price demand may be expressed in the form of small equation.
Dx = f(Px)
Price demand explains the relation between price and quantity demanded of a commodity. Price demand states that there is an inverse relationship between price and demand.
Law of demand :
Marshall defines the law of demand as, “The amount demanded increases with a fall in price and diminishes with a rise in price when other things remain the same”. So, the law of demand explains the inverse relationship between the price and quantity demanded of a commodity.
Demand schedule :
It means a list of the quantities demanded at various prices in a given period of time in a market. An imaginary example is given below.
| Price in ₹ | Quantity Demanded in units |
| 5 | 10 |
| 4 | 20 |
| 3 | 30 |
| 2 | 40 |
| 1 | 50 |
The table shows that as the price falls to ₹ 1/- the quantity demanded is 50 units, when price ₹ 5/- he is buying 10 units. So, there is inverse relationship between price and demand. Price is low demand will be high and price is high demand will be low. We can illustrate the above schedule in a diagram.
In the above diagram, on X-axis demand is shown and price is on Y-axis. DD is the demand curve. Demand curves slopes downward from left to right.
Assumptions :
- No change in the income of consumer.
- The taste and preferences of the consumers remain same.
- The prices of related goods remain the same.
- New substitutes are not discovered. ,
- No expectation of future price changes.
Question 3.
Explain the exceptions of law of Demand.
Answer:
In Economics demand means a desire which is backed up by ability to buy and willingness to pay the price. Thus demand will be always at a price and time.
According to Marshall “The amount demanded increases with a fall in price and diminishes with rise in price when other things remain the same”.
Exceptions :
In certain situations, more will be demanded at higher price and less will be demanded at a lower price. In such cases the demand curve slopes upward from left to right which is called an exceptional demand curve. This can be shown in the following diagram.
In the diagram when price increases from OP to OP1 demand also increases from OQ to OQ1 This is opposite to law of demand.
1) Giffen’s Paradox :
This was stated by Sir Robert Giffen. He observed that poor people will demand more of inferior goods, if their prices rise. Inferior goods are known as Giffen goods.
Ex : Ragee, Jowar etc. He pointed out that in case of the English workers, the law of demand does not apply to bread. Giffen noticed that workers spent a major portion of their income on bread and only small portion on meat.
2) Veblen Effect (Prestigious goods) :
This exception was stated by Veblen. Costly goods like diamonds and precious stones are called prestige goods or veblen goods. Generally rich people purchase those goods for the sake of prestige. Hence, rich people may buy more such goods when their prices rise.
3) Speculation :
When the price of a commodity rises the group of speculators expect that it will rise still further. Therefore, they buy more of that commodity. If they expect that there is a fall in price, the demand may not expand.
Ex : Shares in the stock market.
4) Illusion :
Sometimes, consumer develop to false idea that a high priced good will have a better quality instead of low priced good. If the price of such good falls, demand decreases, which is contrary to the law of demand.
Question 4.
Illustrate the reasons for negative sloping demand curve.
Answer:
According to Marshall, “The amount demanded increases with a fall in price and diminishes with a rise in price when other things remain the same”.
The law of demand explains inverse relationship between the price and quantity demanded of a commodity. Therefore, the demand curve slopes downward from left to right.
There are some other reasons also responsible for downward sloping demand curve.
1) Old and New Buyers :
If the price of a good falls, the real income of the old buyers will increase. Hence, the demand for the good will increase. In the same way, the fall in price attracts new buyers and will be able to built after a fall in its price. So the demand curve slopes downwards from left to right.
2) Income Effect :
Fall in price of commodity the real income of its consumers increase. The increase in real income encourages demand for the commodity with reduced price. The increase in demand on account of increased in real income is known as income effect.
3) Substitution Effect :
When the price of commodity falls, it will become relatively cheaper than its substitutes. The increase in demand on account of increase in real income is known as income effect.
4) Law of Diminishing Marginal Utility :
According to this law, if consumer goes on consuming more units of the commodity, the additional utility goes on diminishing. Therefore, the consumer prefers to buy at a lower price. As a result the demand curve has a negative slope.
![]()
Question 5.
Discuss the concept of income demand.
Answer:
Income demand :
It explains the relationship between consumers income and various quantities of various levels of income assuming other factors like price of goods, related goods, taste etc; remain the same. It means if income increases quantity demand increases and viceversa. This can be shown in the following form.
Dx = f(Y)
The functional relationship between income and demand may be inverse or direct depending on the nature of the commodity. This can be shown in the following table.
| Income | Demand | |
| Superior good | Inferior good | |
| 2000 | 4 | 12 |
| 4000 | 6 | 10 |
| 6000 | 8 | 8 |
| 8000 | 10 | 6 |
| 10,000 | 12 | 4 |
Superior goods :
In case of superior goods quantity demanded will increase when there is an increase in the income of consumers.
In the diagram ‘X’ axis represents demand, OY axis represents income, YD represents the income demand curve. It is showing positive slope whenever income increased from OY to OYx, the demand of superior or normal goods increases from OQ to OQ1
This may happen in case of Veblen goods.
Inferior goods :
On the contrary quantity demanded of inferior goods decreases with the increase in incomes of consumers.
In the diagram, on ’OX’ axis measures demand and OY axis represents income of the consumer. When the consumer income increases from OY to OY1 the demand for a com-modity decreases from OQ to OQ1 So the YD’ curve is negative sloping.
Question 6.
Explain the concept of Cross Demand.
Answer:
Cross demand :
Cross demand refers to the relationship between any two goods which are either complementary to each other or substitute for each other. It explains the functional relationship between the price of one commodity and quantity demanded of another commodity is called cross demand.
Dx = f(Py)
Where, Dx = demand for ‘X’ commodity
Py = Price of y commodity
f = function
Substitutes :
The goods which satisfy the same want are called substitutes.
Ex : Tea and coffee; pepsi and coca-cola etc. In the case of substitutes, the demand curve has a positive slope.
In the diagram ‘OX’ axis represents demand of tea and OY axis represents price of coffee. Increase in the price of coffee from OY to OY2 leads to increase in the demand of tea from OQ to OQ2.
Complementaries :
In case of complementary goods, with the increase in price of one commodity, the quantity demanded of another commodity falls.
Ex: Car and Petrol. Hence, the demand curve of these goods slopes downward to the right.
In the diagram if price of car decreases from OP to OP2 the quantity demand of petrol increases from OQ to OQ2. SO cross demand i.e., CD curve is downward sloping.
Question 7.
What is elasticity of demand?
Answer:
In Economic theory, the concept of elasticity of demand has a significant role. Elasticity of demand means the percentage change in quantity demanded in response to the percentage change in one of the variables on which demand depends.
Elasticity of demand changes from person to person, place to place, time to time and one commodity to another.
Accoridng to Marshall, “The elasticity of demand in a market is great or small according as the amount demanded increases much or little for a given fall in price”.
The concept of elasticity of demand explains how much or to what extent a change in any one of the independent variables leads to a change in the dependent variable.
There are three kinds of elasticity of demand.
- Price Elasticity of demand
- Income Elasticity of demand
- Cross Elasticity of demand.
Question 8.
Define Price Elasticity of demand.
Answer:
Price elasticity of demand is the responsiveness of quantity demanded of a good to a change in the price of that commodity. Alfred Marshall developed the concept of price elasticity of demand. A change in the price of a particular good will never bring uniform change in the quantity demanded.
Other things remaining constant, price elasticity measures the change in the quantity demanded of a good in response to a change in its price. Thus, price elasticity of demand is the ratio of percentage change in quantity demanded of a good and percentage change in its price.
Prof. Marshall suggested the following formula to measure price elasticity of demand.
Where, q = quantity; p = price;
∆q = change in demand; ∆p = change in price
It is to be noted that while calculating price elasticity of demand other things like income, prices of all related goods, tastes, preference etc. are assumed to be constant. It is also to be noted that price elasticity of demand is negative because of the inverse relationship between price and quantity demanded. For the sake of convenience or simplicity the minus sign is ignored and only the numerical value of the elasticity coefficient is considered.
Types of Price Elasticity of Demand :
If the price of a commodity increases, its quantity demanded will fall. The rate of change in demand is not always proportionate to the rate of change in price. For some commodities a smaller change in price leads to a greater change in quantity demanded. In such a case, the demand is elastic on the other hand, even a greater change in price may lead to only a smaller change in the quantity demanded. In such a case, we say that the demand is inelastic. The following are the types of elasticity of demand :
- Perfectly Elastic demand (Ed = ∞)
- Perfectly Inelastic demand (Ed = 0)
- Unitary Elastic demand (Ed = 1)
- Relatively Elastic demand (Ed > 1) and
- Relatively Inelastic demand (Ed < 1).
![]()
Question 9.
What are the basic determinants of price elasticity of demand?
Answer:
It is not easy to say that the demand for a commodity is elastic or inelastic. Elasticity of demand for a commodity varies from person to person, place to place and time to time. Many factors determine the degree of elasticity. Among them, the following are some of the important factors on which elasticity of demand for a commodity depends.
1) Nature of the Commodity :
In case of necessaries, the elasticity of demand will be inelastic. For example, rice, pulses, sugar and salt. Though the prices of these necessaries change, the quantity demanded remains the same. On the other hand, in case of luxuries the demand is more elastic. Ex. demand for gold, diamonds and other costly goods are more elastic.
2) Availability of Close Substitutes :
Prices of substitutes influece the demand for a commodity up to a certain extent. For instance, an increase in the price of Colgate leads to an increase in the demand for Close Up and vice versa. In case where substitute are available the elasticity of demand will be high but in case of non-availability of substitutes the elasticity of demand will be low.
3) Complementary Goods :
Car and fuel or shoes and socks are used jointly because they are complementaries. For instance, if the price of car increases the demand for fuel decreases and if the price of car decreases the demand for fuel increases. If the demand of car is elastic, then the demand for petrol will also be elastic and viceversa.
4) Multiple Uses of the Commodity :
The more the possible uses of commodity the greater will be its price elasticity and vice versa. Let us illustrate with an example of milk which has several uses. If its price falls, it can be used for a variety of purposes like preparation of curd, cream, ghee and sweets. But if its price rises, its use will be restricted only to feed children and sick persons. Similarly, coal and electricity have multiple uses and will have elastic demand.
5) Postponement of Purchases :
One can certainly postpone the purchases of certain goods like vehicles, ornaments and AC units from present to furture as they have elastic demand. But in case of life saving medicines the demand wall be inelastic, as we cannot postpone the purchases of such goods even if the prices of medicines increase.
6) Proportion of Income Spent :
If the propotion of income spent On a particular commodity is very small, demand for it will tend to be inelastic. For instance, demand for salt, newspapers, match boxes etc. is inelastic. Others like ACs, vehicles etc. will have elastic demand because a major amount has to be allotted to purchase these goods.
7) Period of Time :
In the long run, demand will be more elastic. Longer the time period considered, greater will be the possibility of substitution for a cheaper good. For example, if the price of petrol increases in the short run, it may not be possible to replace the petrol engines with diesel engines but in the long run, it can be possible to replace petrol engines because diesel is now relatively cheaper.
8) Price Level :
If the price of a good is too high or too low, then the elasticity of demand for these goods will be inelastic. On the other hand, if the price is moderate, then the elasticity of demand of these goods will be elastic.
9) Goods Leading to Addiction :
In case of habit forming commodities like tobacco and alcohol, the demand for such goods will tend to be inelastic. Consumers who are accustomed to these goods will buy them even if the prices of these goods increase.
10) Income Group :
The economy consists of the various income groups. In general, the demand for major commodities purchased by higher income groups will be inelastic as they do not bother about price changes. On the other hand, the demand of middle and lower income groups will be elastic as they will be very sensitive to price changes.
Thus, it will be difficult to say whether a commodity has elastic or inelastic demand.
Question 10.
Point out the importance of price elasticity of demand.
Answer:
There are several uses of price elasticity of demand both for business and government particularly in decision making. The following are the some of the important areas where price elasticity of demand is useful.
1) Monopoly Market :
If the demand for a product has different elasticities in different markets, the producer can fix different prices in different markets. A monopolist will fix a higher price when the commodity has inelastic demand but he will fix a lower price when the commodity has elastic demand.
2) Joint Products :
The elasticity of demand is useful in the price fixation of joint goods like meat and fur, sugar and molasses etc. It is too difficult to ascertain separate costs of these joint goods. In such a case, the producer will be guided by elasticity of demand to fix the prices of joint goods. So, a higher price is fixed for a good with inelastic demand and lower price for a good with elastic demand.
3) Government :
The commodities of some industries have inelastic demand. Such industries are declared as ‘public utilities’. Keeping in view the welfare of the people, the government will undertake these industries which have inelastic demand. Railways is one of the best examples.
4) International Trade :
Trade between two countries is possible only by taking into consideration the mutual elasticities of demand for each other’s products. Terms of trade’ implies the rate at which one unit of domestic commodity will exchange for unit of a foreign commodity. In claculating the terms of trade, both countries have to take into account the mutual elasticities of demand for their products.
5) Ministry of Finance :
The government imposes taxes for revenue. While imposing taxes on commodities, the finance minister selects different goods based on their price elasticities. When the government is in need of more revenue it chooses those commodities which have inelastic demand for tax imposition.
6) Management :
If the demand for workers is inelastic, the demand of trade unions to rasie wages will be fruitful. If the demand for workers is elastic, the efforts of trade unions to raise wages may not be successful.
7) Prosperity in Midst of Plenty :
The concept of elasticity explains the paradox of poverty i.e., poverty in the midst of plenty. For instance, bumper crop of food grains should bring agricultural prosperity. But due to inelastic nature of food grains demand, the agricultural sector receives low prices for the produce.
8) Producers :
Volume of goods must be produced in accordance with demand for the commodity. Whenever the demand for the commodity is inelastic, the producer will produce more commodities to take advantage of higher price. Hence, elasticity of demand helps in determining the volume of output.
![]()
Question 11.
Describe the income and cross elasticities of demand.
Answer:
The income elasticity of demand and cross elasticity of demand are as follows.
Income Elasticity of Demand :
Income elasticity of demand shows the degree of re-sponsiveness of quantity demanded of a commodity to a change (increase or decrease) in the income of the consumer, other things remaining constant.
Where, q = quantity, y = income, ∆q = change in quantity demanded,
∆y = change in income.
Cross Elasticity of Demand :
Cross elasticity of demand refers to the change (increase or decrease) in the quantity demanded of a good in response to the change (increase or decrease) in the price of its related goods, other things remaining constant. There are certain goods whose demand depends not only on their price but also on the prices of related goods.
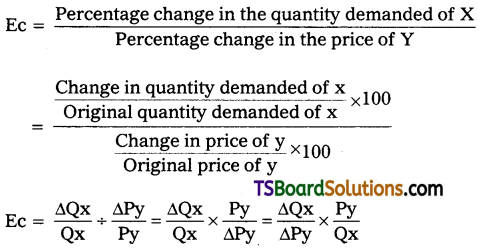
Where, Qx = quantity demanded for commodity x, Py = price of commodity Y, ∆Qx = change in quantity demanded for commodity X, and ∆Py = change in price of commodity Y.
Very Short Answer Questions
Question 1.
What is Price Demand?
Answer:
It explains the functional relationship between price of good and quantity demanded when the remaining factors are constant. It shows inverse relationship between price and demand.
Dx = f(Px)
Dx = Demand for X commodity
Px = Price of X
Question 2.
Prepare Individual Demand Schedule.
Answer:
It explains the relationship between various quantities purchased at various prices by a single consumer in the market.
![]()
Question 3.
Prepare Market Demand Schedule.
Answer:
It shows the total demand for a group at a particular time at different prices in the market.
Question 4.
What is Demand Function?
Answer:
Demand function shows the functional relationship between quantity demanded at various factors that determine the demand for a commodity. It can be expressed as follows.
Dx = f(Px, P1, …………. Pn, Y, T)
Where,
Dx = Demand for good X
Px = price of X
Pi1 …. Pn = Prices of substitutes and complementary
Y = Income of consumer
T = Tastes
f = functional relationship
Question 5.
Explain Giffen’s Paradox (or) Giffen Goods.
Answer:
It means necessary goods. Sir Robert Giffen in mid 19th century observed that the low paid workers in England purchased more bread when its price increased by decreasing in the purchase of meat. The increase in demand for bread when price increased is an exception to the law of demand, it is known as Giffen’s Paradox.
Question 6.
Explain Veblen Goods (or) Prestigious Goods.
Answer:
This is associated with the name of T. Veblen. Costly goods like diamonds and cars are called Veblen goods. Generally rich people purchase those goods for the sake of prestige. Hence, rich people may buy more such goods when their prises rise.
Question 7.
What is Income Demand?
Answer:
It shows the direct relationship between the income of the consumer and quantity demanded when the other factors remain constant. There is direct relationship between income and demand for superior goods. Inverse relationship between income and demand for inferior goods.
Dx = f(Y)
![]()
Question 8.
What is Cross Demand?
Answer:
Cross demand refers to the relationship between any two goods which are either complementary to each other or substitute of each other at different prices.
Dx = f(Py)
Question 9.
Explain Substitute goods.
Answer:
These are goods which satisfy the same want.
Ex : Tea and coffee. In this case the relationship between demand for a product and the price of its substitute is positive in its nature.
Question 10.
Explain Complementary Goods.
Answer:
These are goods which satisfy the same wants jointly.
Ex: Shoes and socks, car and petrol. The relationship between complementary goods is inverse.
Question 11.
What is Price Elasticity of Demand?
Answer:
It is the percentage change in quantity demanded of a commodity as a result of percentage change in price of a commodity.
![]()
Question 12.
What are the types of price elasticity of demand?
Answer:
If the price of a commodity increases, its quantity demanded will fall. The rate of change in demand is not always proportionate to the rate of change in price. For some commodities a smaller change in price leads to a greater change demand, here the demand is elastic. A greater change in price many lead to only a smaller change in quantity demanded, here the demand is inelastic. The following are the types of elasticity of demand.
a) Perfectly elastic demand.
b) Perfectly inelastic demand,
c) unitary elastic demand.
d) Relatively elastic demand,
e) Relatively inelastic demand.
Question 13.
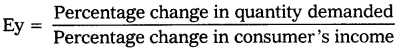
Explain Income Elasticity of Demand.
Answer:
It is the percentage change in quantity demanded of a commodity as a result of percentage change in the income of the consumer.
Question 14.
Explain Cross Elasticity of Demand.
Answer:
It is the percentage change in the quantity demanded of a commodity as a result of proportional change in the price of related commodity.
![]()
Question 15.
What is Perfectly Elastic Demand?
Answer:
If a negligible change in price leads to an infinite change in demand is called perfectly elastic demand. In this case the demand curve is horizontal to ‘X’ axis.
![]()
Question 16.
What is Perfectly Inelastic Demand?
Answer:
Even a great rise or fall in price does not lead and change in quantity demanded is known as perfectly inelastic demand. The demand curve is vertical to ‘Y axis.
Question 17.
Explain Unitary Elastic Demand.
Answer:
The proportionate change in demand is equal to the proportionate change in price. In this case the demand curve will be a rectangular hyperbola.
Question 18.
Explain Relatively Elastic Demand.
Answer:
When a proportionate change in price leads to more than proportionate change in quantity demand is called relatively elastic demand.
Question 19.
Explain Relatively Inelastic Demand.
Answer:
When the proportionate change in price leads to a less than proportionate change in quantity demanded is called relatively inelastic demand.
Question 20.
Define Superior goods.
Answer:
In case of superior or normal goods, quantity demanded increases when there is an increase in the income of consumers. Income demand for superior goods exhibits a positive relationship between the income and quantity demanded. In such a case, the demand curve slopes upwards from left to right.
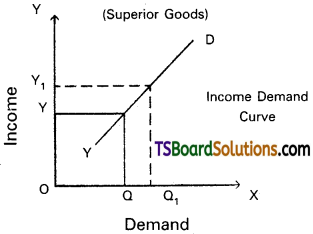
In figure OX-axis represents quantity demanded for superior goods and OY-axis rep-resents the income of the consumer. YD represents the income demand curve showing a positive slope. Whenever income increases from OY to OY1 the quantity demanded of superior or normal goods increases from OQ to OQ1 This may happen in case of Veblen goods.
![]()
Question 21.
Define Inferior Goods.
Answer:
The goods whose income elasticity of demand is negative for levels of income are termed as inferior goods. In case of inferior goods if income increases demand decreases and vice-versa. The income demand for inferior goods has a negative slope.